In today’s comprehensive USDCAD technical analysis, we will first scrutinize Canada’s current economic conditions. Then, we will meticulously delve into the details of the technical analysis of the USDCAD pair.
Declining Bond Yields in Canada
Bloomberg—In late November, the yield on Canada’s 10-year government bonds fell to 3.5%, a level not seen since August. This decline reflects the growing belief that the rate hike cycles by both the Bank of Canada and the Federal Reserve are ending.
Surprisingly, domestic inflation in Canada dropped to 3.1% in October, lower than the Bank of Canada’s expected 3.5% rate, lasting until the second half of 2024. These developments, coupled with the highest unemployment rate in nearly two years and signs of a slowing Canadian GDP for the second consecutive quarter, lead many to anticipate that the central bank will pause further rate increases.
Recovery in Canadian Stocks
On Wednesday, the S&P/TSX Composite Index saw a modest recovery, hovering around the 20,080 mark. This rebound follows minor losses earlier in the week as investors awaited key earnings reports and the October labor data for insights into the economy’s ability to withstand higher interest rates.
Banks performed well, particularly ahead of the earnings announcements from RBC and TD Bank, which are expected to shed light on the effects of prolonged hawkish monetary policy on delinquency rates in Canadian credit. Meanwhile, energy companies traded positively ahead of an important OPEC meeting, with Saudi Arabia raising concerns about the organization’s increased output. Enbridge’s stock rose over 1% following its prediction of higher core earnings in 2024.
Canada’s Unexpected Current Account Deficit
Surprisingly, Canada posted a current account deficit of CAD 3.2 billion in the third quarter of 2023. This was a contraction from the revised CAD 7.3 billion in the previous quarter but fell short of market expectations of a CAD 1 billion surplus. The investment income surplus decreased to CAD 2.1 billion from CAD 4.8 billion in the second quarter.
Meanwhile, the services deficit increased slightly, and the goods account became a surplus, signaling mixed economic signals.
USDCAD Technical Analysis – Bonds Stocks Deficits
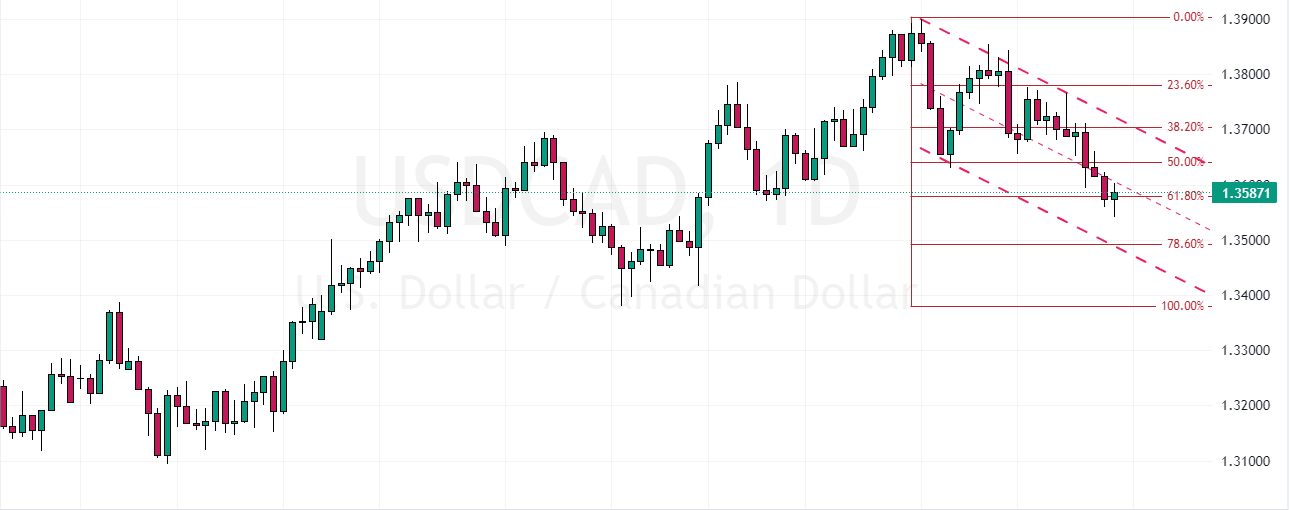
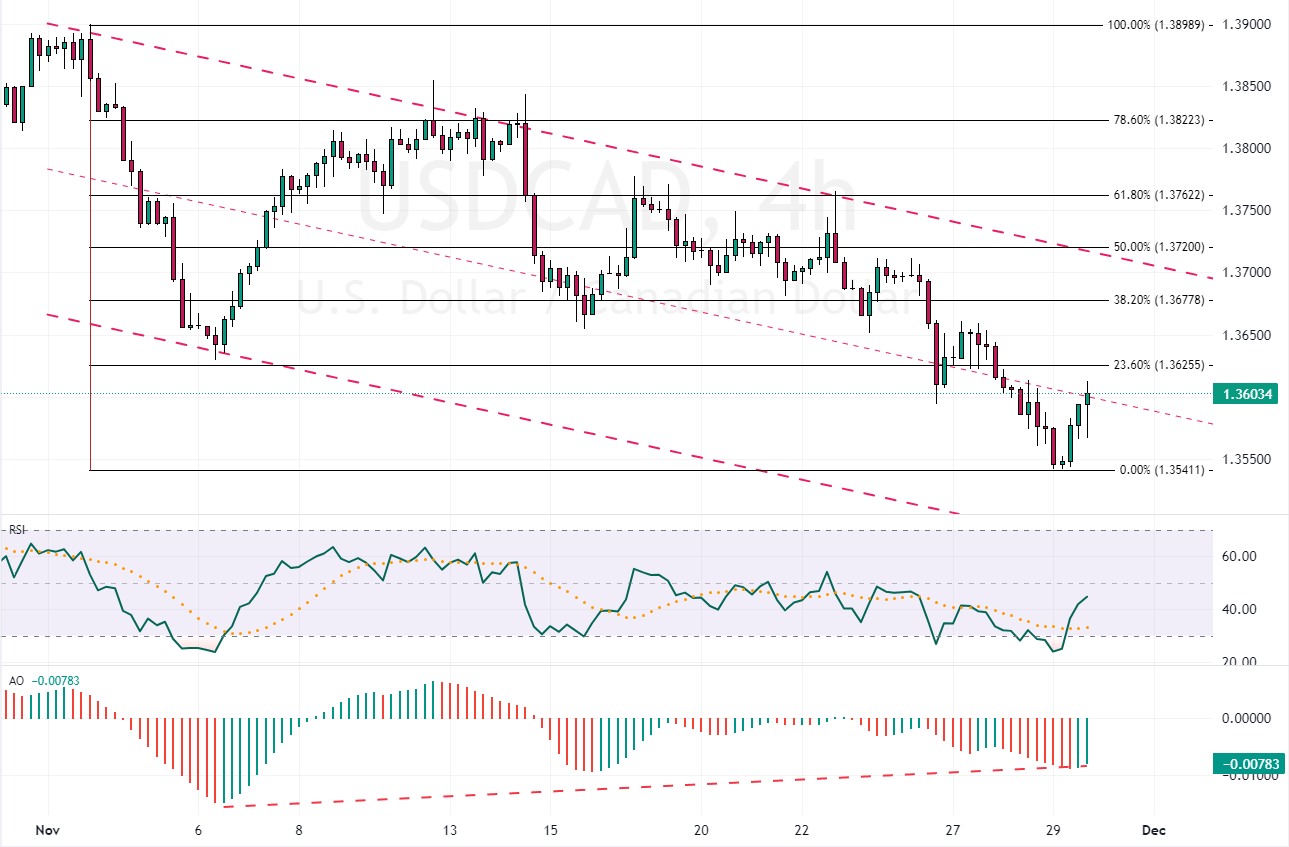
FxNews—Selling pressure on the USDCAD has eased today following the pair’s closure below the median line of the flag. It is stabilizing itself below the middle line, around the 64.8% Fibonacci level, as seen in the 4-hour chart. The bearish target appears to be around 1.35, coinciding with the 78.6% Fibonacci level.

A closer look at the USDCAD 4-hour chart reveals divergence in the Awesome Oscillator, with the indicator’s bars turning green. This is further supported by the RSI indicator, which suggests a price correction scenario. However, the 23.6% Fibonacci level in the 4-hour chart is acting as a resistance, preventing further gains in recovering recent losses. As long as the pair remains below this resistance, the correction phase will likely stay within the 1.35 to 1.36 range.


J.J Edwards is a finance expert with 15+ years in forex, hedge funds, trading systems, and market analysis.


