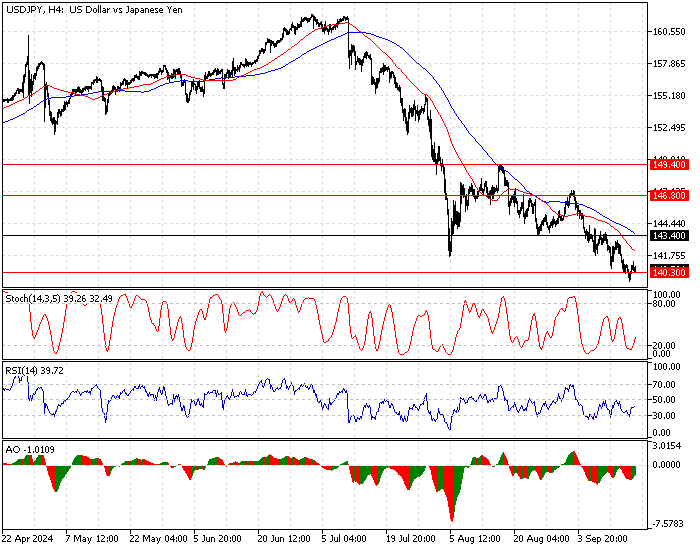
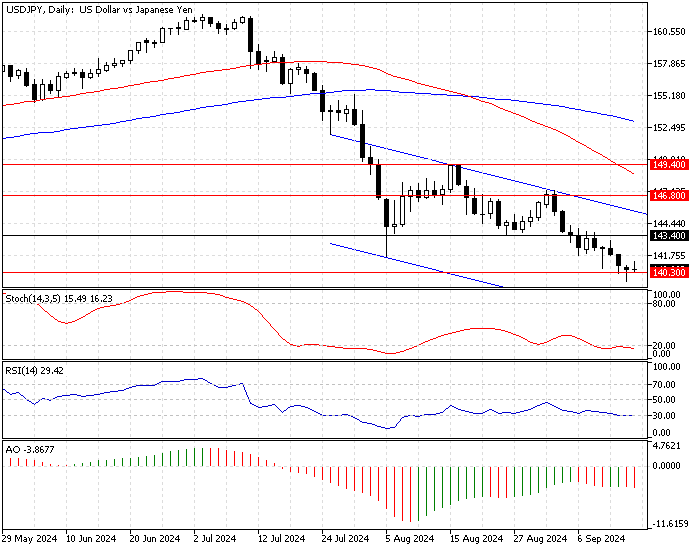
FxNews—The U.S. dollar is in a bear market against the Japanese yen. As of this writing, the USD/JPY currency pair tests the 140.3 (December 2023 Low) support, while the relative strength index and stochastic are oversold.
The USD/JPY 4-hour chart below demonstrates the price, support, resistance levels, and technical indicators used in today’s analysis.

USDJPY Technical Analysis – 17-September-2024

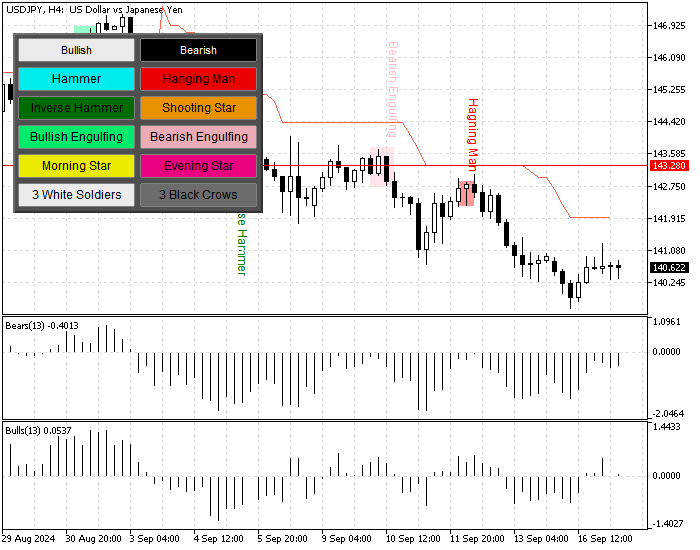
In addition to the momentum indicators, the Awesome oscillator bars are red and below the signal line, meaning the primary trend is bearish. That said, the price is also below the Supertrend indicator and the 50—and 100-period simple moving averages, signaling that the bear market is in control.

Overall, the technical indicators suggest the primary trend is bearish, but the USD/JPY price could consolidate near the upper resistance levels before the downtrend continues.
USD/JPY Price Forecast
Immediate resistance is at 140.3. While this level holds, the USD/JPY price can potentially rise to test the broken support at 143.4, the August 5 low. If this scenario unfolds, traders and investors should monitor the 143.4 mark closely for bearish signals, such as candlestick patterns.
Furthermore, if the downtrend resumes, the next bearish target will likely be the July 14 low at 137.2. Please note that the bearish scenario should be invalidated if the USD/JPY price crosses above the 143.4 resistance.
USD/JPY Bullish Scenario
The critical bullish barrier lies at the 143.4 mark and the descending trendline. If the bulls (buyers) push the USD/JPY price above 143.4, the rise can extend to 146.8 (September 2 High), followed by 149.4 (August 15 High).
USD/JPY Support and Resistance Levels
Traders and investors should closely monitor the key levels below to make informed decisions and adjust their strategies accordingly as market conditions shift.
- Support: 140.3 / 137.2
- Resistance: 143.4 / 146.8 / 149.4