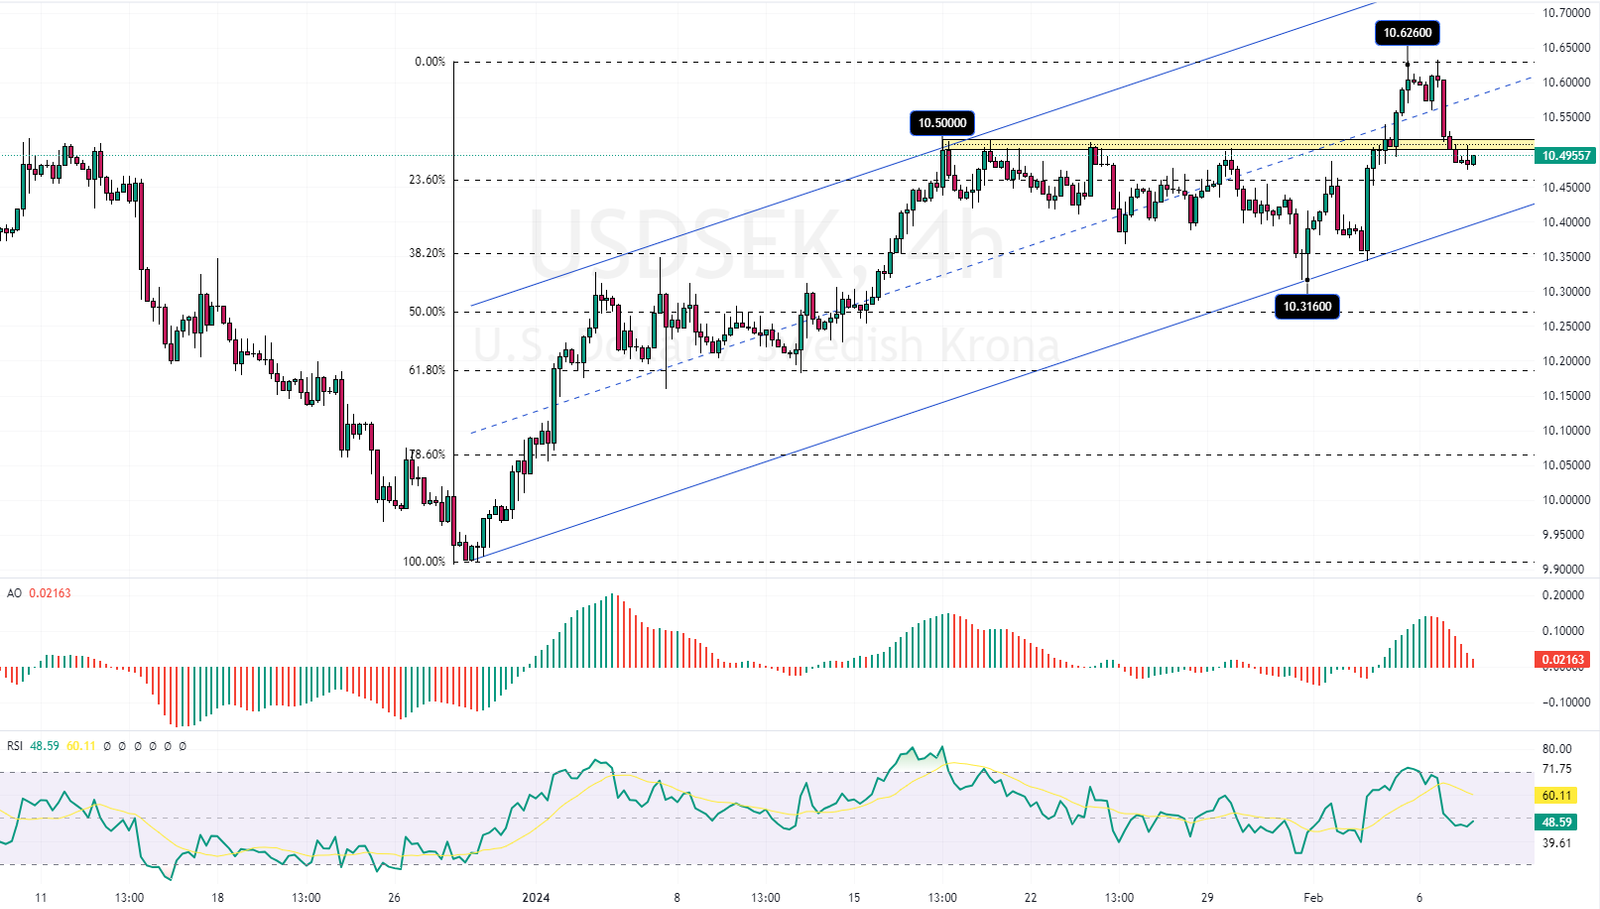
FxNews – The USDSEK currency pair (U.S. Dollar vs. Swedish Krona) price hovers around 10.48 as of writing in Wednesday’s trading session. On Monday, the USD/SEK price exceeded the 10.5 resistance and the 50% Fibonacci level. However, the bulls seem to be failing to sustain the price above the 10.5 support.
USDSEK Technical Analysis and Forecast
The technical indicators on the daily chart are giving mixed signals. The relative strength indicator hovers above the 50 line but is declining, and the awesome oscillator’s bars are green.
We zoom into the 4-hour chart to better understand the USDSEK price action.

The USDSEK 4-Hour Chart Analysis
The USDSEK 4-hour chart shows the price stabilizing below the 10.5 support, which now acts as resistance. The last 4-hour candlestick has a long wick shadow that tells us the 10.5 level is tested, and the market is getting ready to see more sellers’ pressure.

The 4-hour chart’s technical indicators are bearish. The awesome oscillator bars are red, and the RSI hovers below the 50 level. From a technical standpoint, the USD/SEK price will likely fall and test the lower band of the bearish flag, followed by the 38.2% Fibonacci support and the 10.35 mark.
Conversely, the bearish outlook should be invalidated if the market returns above the 10.5 resistance and stabilizes itself. The road to 10.6 resistance, followed by the upper line of the rising channel, will be paved.
Sweden’s Service Sector Growth Picks Up in January 2024
Bloomberg—In January 2024, Sweden’s Services PMI rose to 51.8 from 50.3 the month before, marking the second month of growth. This was the highest score since July 2023, driven by more business (56.2 compared to December’s 51.3) and quicker supplier deliveries (55.3, up from 52.4).
However, there was a slight drop in new orders (47 from 47.9) and a slight decrease in jobs (50.9 down from 51.1). The prices for raw materials and other inputs decreased, with the index falling to 55.9 from 57.8. Jörgen Kennemar from Swedbank, analyzing the PMI, mentioned that this growth suggests the economic downturn in business is leveling off. Yet, he warned that recovery might be slow, mainly due to the struggling global economy.