FxNews—The Aussi dollar trades sideways between May’s high at $0.671 and June’s low at $0.658 against the U.S. dollar. As of writing, the AUD/USD currency pair trades at $0.66, testing the daily simple moving average of 50.
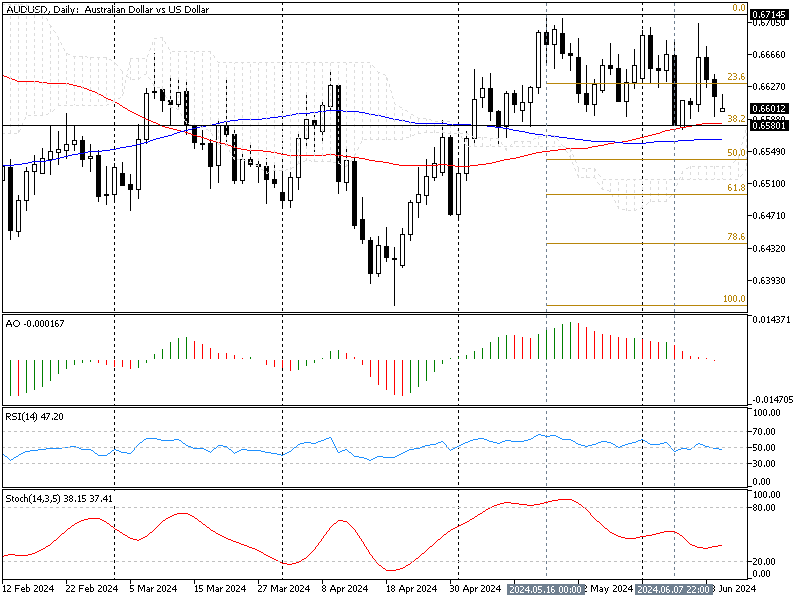
The daily chart below shows the Fibonacci levels, the current price of the AUD/USD pair, and the key technical indicators that will be utilized in today’s analysis.
AUD/USD Technical Analysis Daily Chart

The primary trend is bullish because the price is above the simple moving averages of 50 and 100. The key support level for the bull market is the %38.2 Fibonacci at $0.658, whereas the technical indicators suggest the market lacks momentum and might continue its sideways trading.
- The awesome oscillator bars are small, clinging to the signal line with a value of -0.0001, meaning the market is not bullish or bearish in the short term.
- The relative strength index (RSI 50) indicator value is 47, moving alongside the median line, signifying the market lacks momentum but is mildly bearish.
- The stochastic oscillator value is 37 and rising. This development in the %K period suggests that the AUD/USD currency pair is bent to a weak bullish trend.
As explained, the AUD/USD daily chart doesn’t give any specific signal for trading. Therefore, we zoom into the 4-hour chart to conduct a detailed analysis.
AUD/USD Technical Analysis 4-Hour Chart

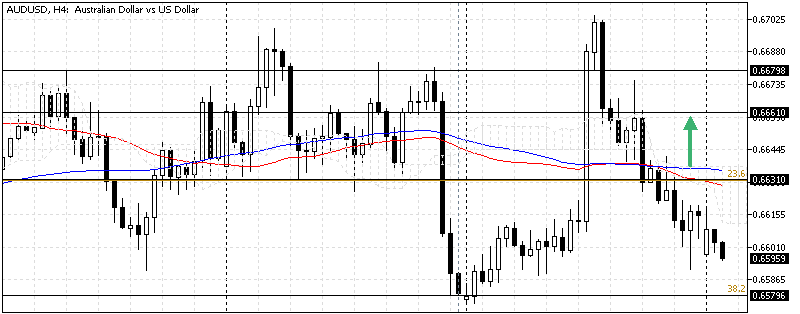
The 4-hour chart demonstrates that the bear market prevails in short-term trading, but selling pressure eased after the price neared the key support level at $0.657. This development in the U.S. dollar price drove the stochastic oscillator into oversold territory, meaning the dollar is overpriced against the Australian currency. Hence, the AUD/USD price might bounce from the key support level.
Other technical indicators suggest the bear market may continue.
- The awesome oscillator value is -0.0011 and decreases with red bars below the signal line, suggesting the bear market is gaining strength.
- The relative strength index is below the median line, recording 41 in the value and declining, meaning the bear market is gaining momentum.
AUD/USD Price Forecast – 17-June-2024

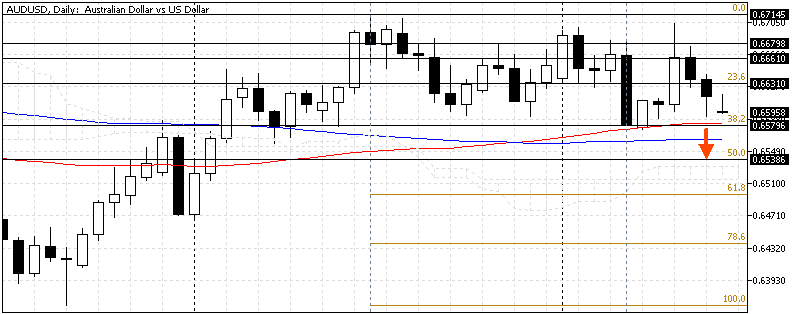
Based on the daily technical analysis of the chart, the primary trend is bullish as long as the Aussie trades are above the key resistance level of $0.657. In this scenario, the 23.6% Fibonacci plays the resistance at $0.663. If the AUD/USD price crosse above the 23.6% Fibonacci, the bull market will likely resume, and the next target could be at $0.663, followed by $0.667.
Bearish Scenario

Key support is at $0.657. If the decline that began on June 12 exceeds $0.657, the following bearish targets could be a simple moving average of 100, followed by the 50% Fibonacci at $0.653.
AUD/USD Key Support and Resistance Level
Traders and investors should closely monitor the key levels below to make informed decisions and adjust their strategies accordingly as market conditions shift.
- Support: $0.657 / $0.653
- Resistance: $0.663 / $0.667 / $0.671
Disclaimer: This technical analysis is for informational purposes only. Past performance is not necessarily indicative of future results. Foreign exchange trading carries significant risks and may not be suitable for all investors. Always conduct your research before making any investment decisions.