FxNews—The New Zealand dollar declined from $0.622 against the U.S. Dollar on June 12, and as of writing, the NZD/USD currency pair trades at about $0.611.
The primary trend is bullish because the NZD/USD rate is above the 38.2% Fibonacci level and the simple moving averages of 50 and 100. Therefore, the recent bearish momentum should be considered as a consolidation phase that might extend to the lower support levels.
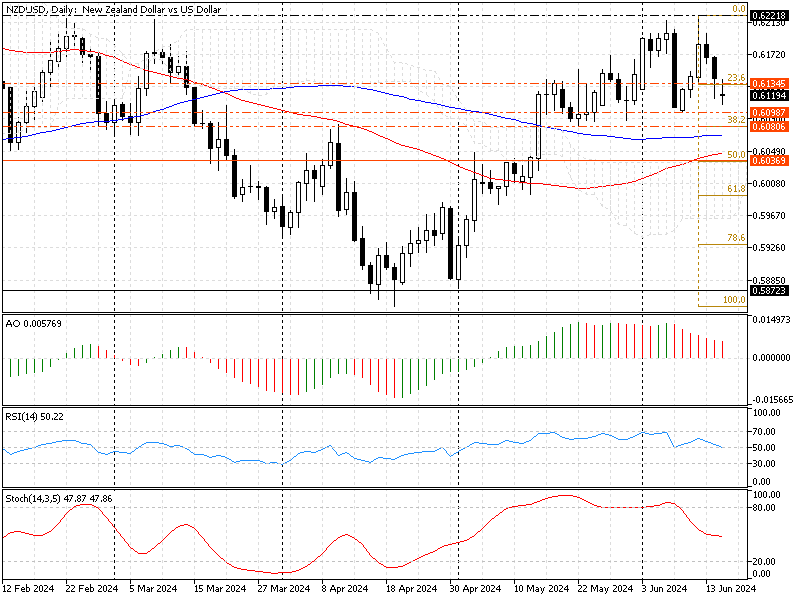
The daily chart below demonstrates the current NZD/USD price and the key technical indicators used in today’s technical analysis.

NZDUSD Technical Analysis – 17-June-2024
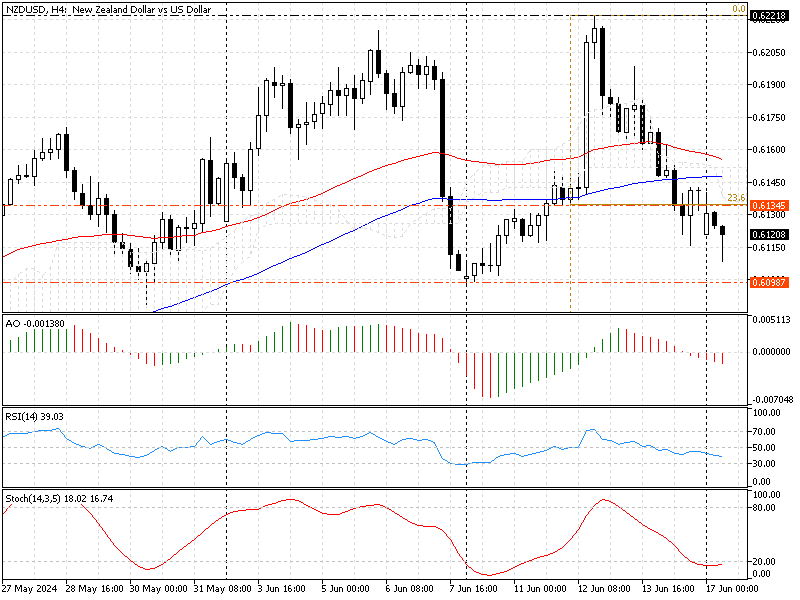
The selling pressure that began on June 12 from $0.622 has driven the price below the Ichimoku cloud, playing the key support level; now, it should be considered the primary resistance. The price also flipped below the simple moving averages of 50 and 100 in the 4-hour chart (image below), another signal of the robust bearish bias in the short term.

The technical indicators suggest the bearish market prevails in the short term, but the NZD/USD could be oversold.
- The awesome oscillator value is -0.001 and below zero with red bars, signaling the downtrend might resume.
- The relative strength index (RSI 14) is below the median line and decreasing, showing a value of 38 in the description. This decline in the RSI value indicates the bearish trend is gaining more momentum.
- On the other hand, the stochastic oscillator (14, 3, 5) is in the oversold territory, suggesting the price might bounce from this point and test the immediate resistance at $0.613.
NZDUSD Price Forecast – 17-June-2024

The primary trend on the daily chart is bullish, and the recent decline should be considered a consolation phase as long as the price of the New Zealand dollar is above the daily moving average of 50 and 100. The immediate resistance is the 23.6% Fibonacci at $0.613, and the buyers are testing this level in today’s trading session.
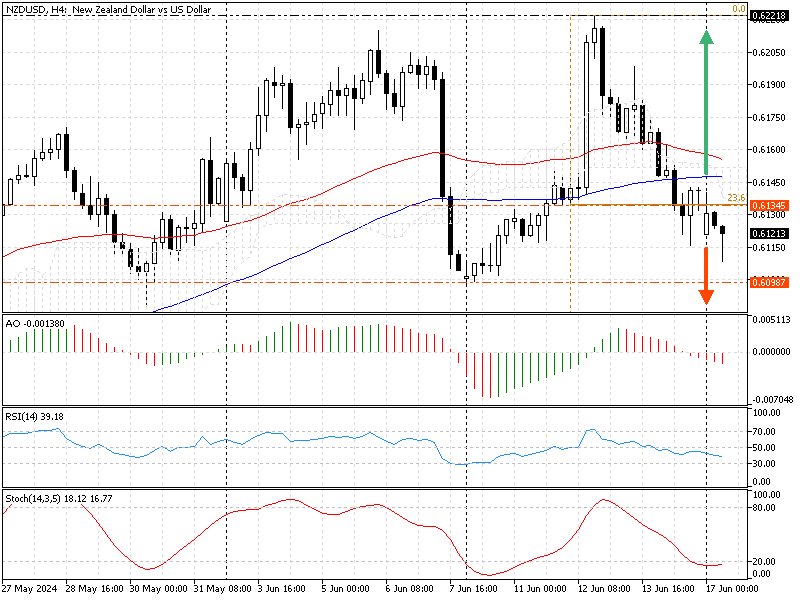
The New Zealand dollar price must remain below $0.613 for the downtrend to resume. The bearish trajectory from $0.622 in this scenario could extend to the 38.2% Fibonacci level at $0.608. If it exceeds this demand area, the next support will be the moving average 100 around the $0.603 mark.
NZD/USD Bullish Scenario
The immediate resistance is the 23.6% Fibonacci at $0.613. The short-term bear market should be invalidated if the NZD/USD exchange rate crosses above this key resistance, a demand zone backed by the Ichimoku Cloud. If this scenario unfolds, the road to testing June’s all-time high at $0.622 will be paved.
NZD/USD Key Support and Resistance Level
Traders and investors should closely monitor the key levels below to make informed decisions and adjust their strategies accordingly as market conditions shift.
- Support: $0.6098 / $0.6080 / $0.6036
- Resistance: $0.613 / $0.6221
Disclaimer: This technical analysis is for informational purposes only. Past performance is not necessarily indicative of future results. Foreign exchange trading carries significant risks and may not be suitable for all investors. Always conduct your research before making any investment decisions.

J.J Edwards is a finance expert with 15+ years in forex, hedge funds, trading systems, and market analysis.


