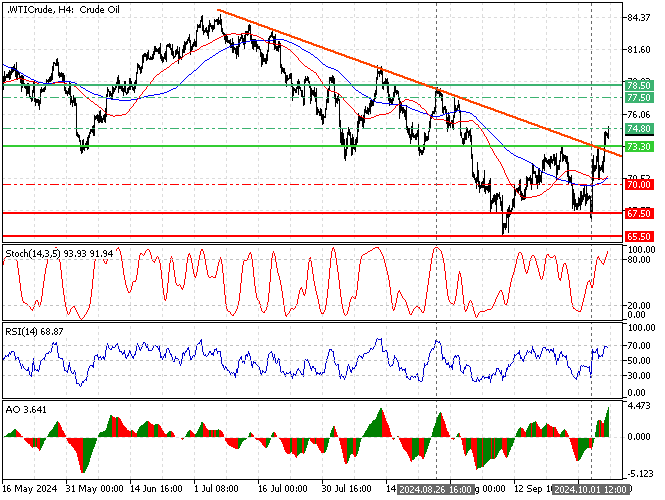
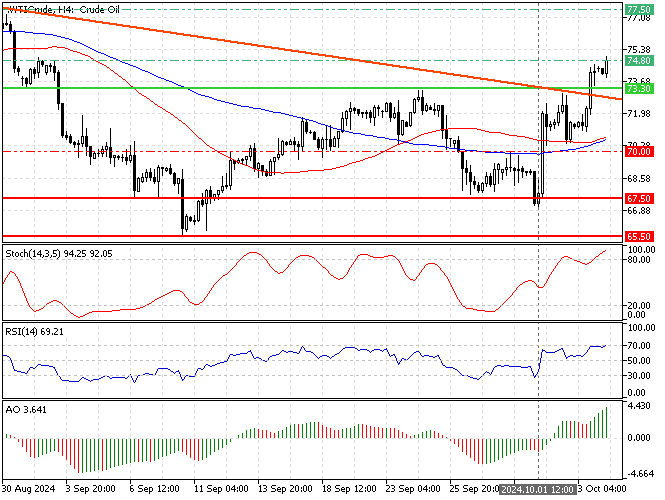
FxNews—Crude Oil price broke above the descending trendline in yesterday’s trading session, testing the $74.8 resistance as of this writing. The 4-hour chart below demonstrates the price, support, resistance levels, and technical indicators utilized in today’s analysis.

Crude Oil Technical Analysis – Price Exceeded $74.8
The primary trend should be bullish, with black gold trades above the 50- and 100-period simple moving averages. Meanwhile, the Stochastic oscillator stepped into overbought territory, signaling that the market is overbought. Hence, the Oil price might soon experience a pullback from the $74.8 resistance.

Furthermore, the Awesome oscillator bars are green and above the signal line, meaning the bull market prevails.
Overall, the technical indicators suggest the primary trend is bullish and should resume after a minor consolidation.
Crude Oil Forecast – 4-October-2024

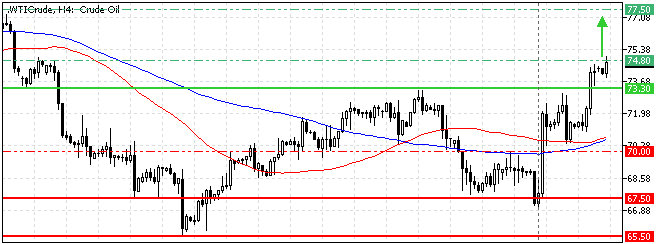
Immediate resistance is at the August 28 low, the $74.8 resistance. The uptrend will likely resume if bulls (buyers) pull the Oil price above $74.8. In this scenario, the next bullish target could be the $77.5 resistance, followed by the August 26 high, the $78.5 resistance.
Please note that the bull market should be invalidated if the Oil price dips below the immediate support at $73.3.
Crude Oil Bearish Scenario – 4-October-2024

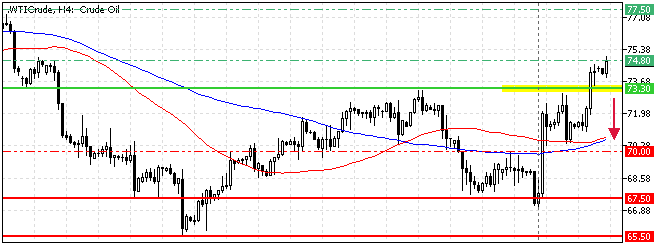
The Stochastic oscillator shows 94 in the description, meaning the Oil price is highly overbought and saturated from buying. If the oil price falls below the immediate support of $73.3, it will trigger a new consolidation phase extending to the 50-period simple moving average at approximately $70.
Furthermore, if bears (sellers) push the Oil price below $70, the decline can spread to the October 1st low at $67.5.
- Next read: Oil Hit $76.5 Amid Middle East Tensions
Crude Oil Support and Resistance Levels – 4-October-2024
Traders and investors should closely monitor the key levels below to make informed decisions and adjust their strategies accordingly as market conditions shift.
- Support: $70.0 / $67.5 / $65.5
- Resistance: $73.3 / $74.8 / $77.5 / $78.5