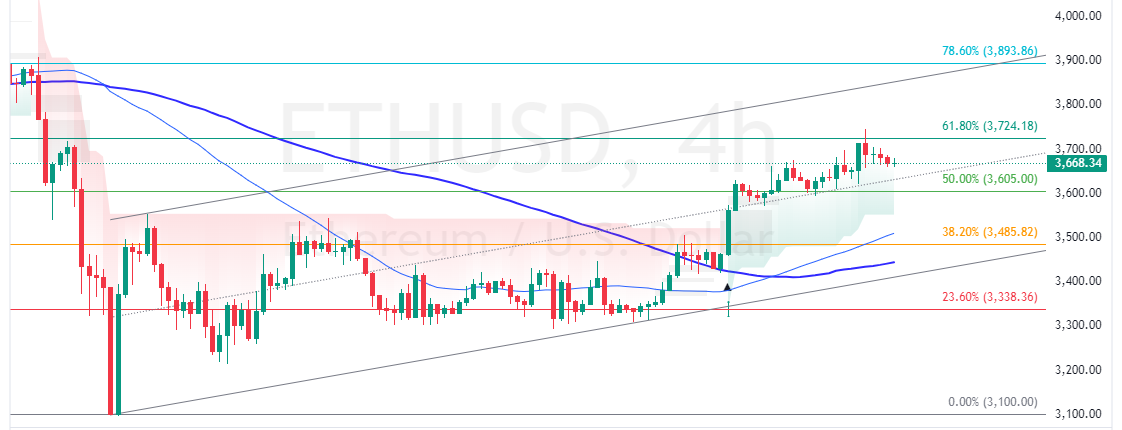
Ethereum holds above the 50.0% Fibonacci support level, trading sideways in a low-momentum bull market. A firm close above the immediate resistance at $3,720 can trigger the uptrend, targeting $3,890.
Ethereum Technical Analysis – 7-January-2025
FxNews—Ethereum has been in a bull market, above the 50- and 100-period simple moving average, and has gained 4.0% of its value since December 24. However, the buying pressure eased at the 61.8% Fibonacci resistance level of $3,700.
As of this writing, the cryptocurrency trades at approximately $3,670, stabilizing above the 50.0% Fibonacci support level.
Regarding the technical indicators:
- The RSI 14 depicts 63 in the description and declining. The indicator also signals divergence, meaning the trend could reverse or start consolidating.
- The Stochastic Oscillator shows 57 in the description, indicating the bull market weakened.
- The Awesome Oscillator histogram is red, above zero, interpreted as the bull market lost momentum.
Overall, the technical indicators suggest that while the primary trend is bullish, ETH/USD has the potential to consolidate near the lower support levels.
Ethereum Aiming Higher Above $3600
Due to the RSI’s divergence signal, joining the bull market at the current price is risky. Therefore, waiting for the ETH to consolidate near the lower support levels is wise.
The immediate support is $3,605, backed by the 50.0% Fibonacci retracement level. From a technical perspective, the downtick in momentum from $3,720 could extend to lower support levels if bears (sellers) push ETH/USD below $3,605.
If this scenario unfolds, the next bearish target could be the 38.2% Fibonacci support level at $3,485. This level can provide a decent bid price to join the bull market.
- Bitcoin Analysis: Technical, Fundamental & News
- Litecoin Gained 7.1%: What’s the Next Target?
- Bitcoin is up 6.6% Amid Divergence Signals: What’s Next?
The Bullish Scenario
The critical support level that divided the bull market from the bear market rests at $3,480, backed by the 38.2% Fibonacci. From a technical standpoint, the bearish bias from $3,720 could extend to the 23.6% Fibonacci at $3,330 if the value of Ethereum drops below $3,480.
In this scenario, the next bearish target could be $3,100.
Ethereum Support and Resistance Levels – 7-January-2025
Traders and investors should closely monitor the ETH/USD key levels below to make informed decisions and adjust their strategies accordingly as market conditions shift.
| Ethereum Support and Resistance Levels – 7-January-2025 | |||
|---|---|---|---|
| Support | 3,600 | 3,480 | 3,330 |
| Resistance | 3,720 | 3,890 | 4,110 |


