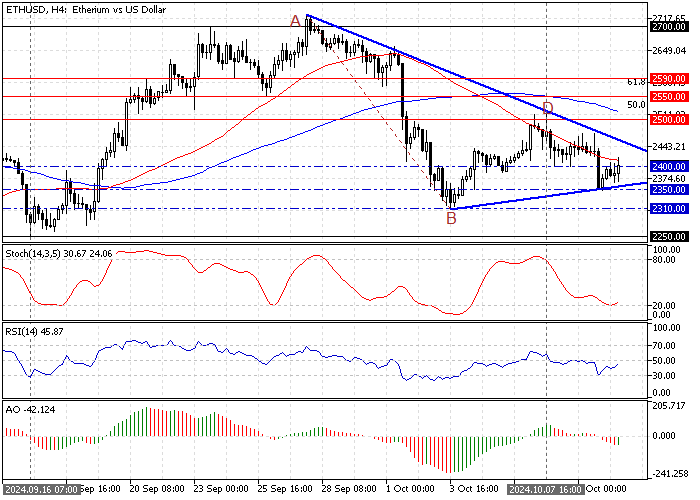
FxNews—Ethereum trading slightly bullish in today’s trading session, testing the AB wave’s %50 Fibonacci retracement level at approximately $2,400 in today’s trading session.
The 4-hour chart below demonstrates the price, support, resistance levels, and technical indicators utilized in today’s analysis.

Ethereum Technical Analysis – 10-October-2024
The primary trend is bearish since the cryptocurrency’s price is below the 50- and 100-period moving average and the descending trendline. Furthermore, the Awesome oscillator, with its histogram in red and below the signal line, signals a bear market prevails.
However, RSI 14 depicts 44 in the description and is rising, indicating the bull market is strengthening. The Stochastic Oscillator also shows a bullish momentum, rising from the 20 levels.

Interestingly, the ETH/USD 4-hour chart formed a symmetrical triangle pattern, and the price is moving sideways, approaching the triangle’s apex. This pattern means that Ethereum poses for a bullish or a bearish breakout.
Overall, the technical indicators suggest the primary trend is bearish and should resume to lower support levels.
Ethereum Price Forecast – 10-October-2024

The immediate resistance is at the October 9 low, the $2,350 mark. The downtrend will likely extend to $2,310, followed by $2,250 (September 16 Low) if the Ethereum price breaks below the immediate resistance.
Please be aware that the bearish outlook should be invalidated if the Ethereum price exceeds the October 10 high at $2,500.
Ethereum Bullish Scenario

The critical resistance is at $2,500. If the Ethereum price exceeds this mark, today’s uptick momentum could turn the trend bullish. If this scenario unfolds, the price can potentially target $2,550.
Ethereum Support and Resistance Levels – 10-October-2024
Traders and investors should closely monitor the key levels below to make informed decisions and adjust their strategies accordingly as market conditions shift.
- Support: $2,350 / $2,310 / $2,250
- Resistance: $2,500 / $2,550 / $2,590