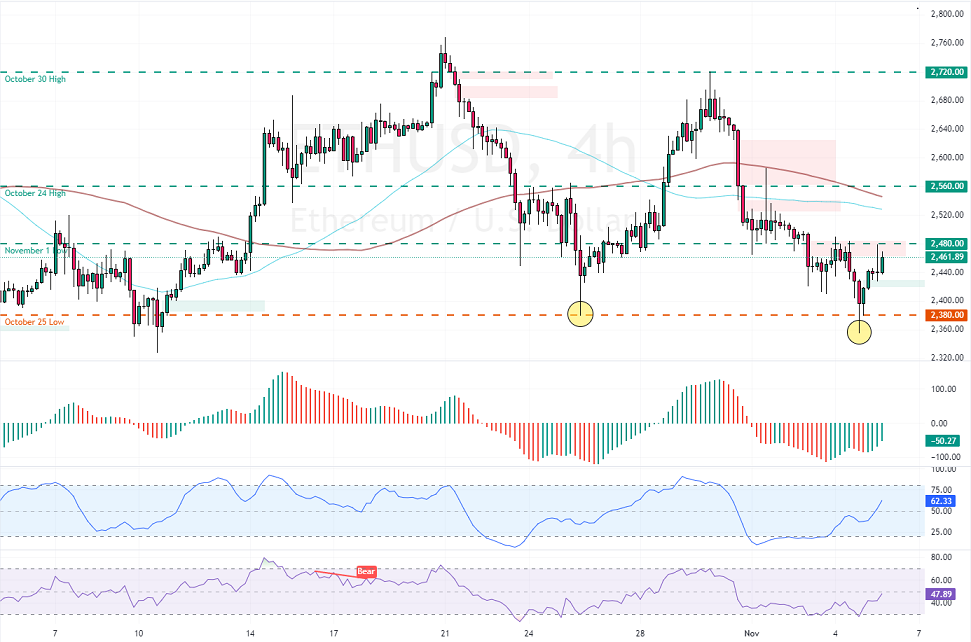
FxNews—Ethereum has formed a double bottom pattern and is currently testing the $2,480 resistance level. Meanwhile, the Awesome Oscillator signals divergence with green bars approaching the zero line from below. This development in the price action and the AO indicator suggests that Ethereum’s price has the potential to rise further.

RSI Points to Bull Market with Room for More Gains
Additionally, the RSI 14 is about to flip above the median line, meaning the bull market strengthens. Furthermore, the Stochastic Oscillator shows a reading of 63, indicating the market is not overbought, so the uptrend should resume.
Overall, the technical indicators suggest that, while the price is below the 100-period simple moving average, ETH/USD has the potential to test upper resistance levels.
Ethereum Price Forecast – 5-November-2024
From a technical perspective, the bullish wave could resume if ETH/USD exceeds $2,480. In this scenario, the next bullish target could be the $2,560 resistance level.
Conversely, a dip below the $2,380 support would invalidate the bullish outlook.