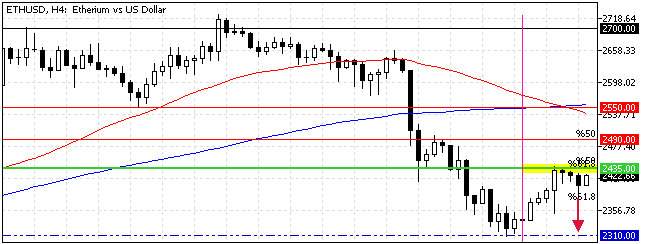
FxNews—Ethereum is experiencing a pullback from $2,310 and tested the $2,435 critical pivot/resistance area today. Notably, the $2,435 mark is in conjunction with the 61.8% Fibonacci retracement level and the October 1 low, making it a robust barrier.
The 4-hour chart below demonstrates the ETH/USD price, support, resistance levels, and technical indicators utilized in today’s analysis.

Ethereum Technical Analysis – Struggle at Major Resistance
The primary trend is bearish because the ETH/USD price is below the 50- and 100-period simple moving averages. However, the other technical indicators signal bullish.
- The Stochastic oscillator shows 67 in the value and is rising. This means the bull market is strengthening and is not overbought.
- The relative strength index records 45 in the description, below the median line, but the value is growing. This indicates the bull market is gaining momentum.
- The Awesome oscillator bars are green but below the signal line, meaning the bear market weakens, and the price might increase.

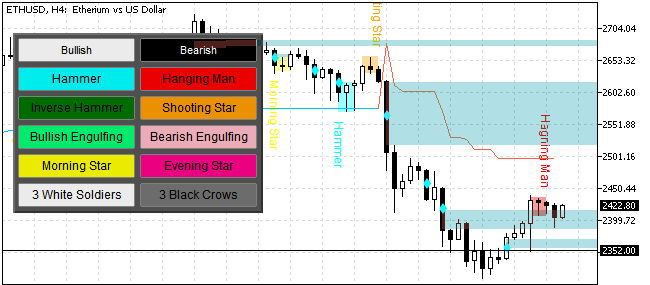
As for the candlestick patterns, the 4-hour chart formed a handing man, signaling a downtrend should resume.
Overall, the technical indicators suggest the primary trend is bearish, but the Ethereum price can rise and test upper resistance levels.
Ethereum Forecast – 5-October-2024

The primary trend is bearish, and the 50- and 100-period simple moving averages made a golden cross. From a technical perspective, the downtrend will likely continue if the ETH/USD rate remains below the $2,435 resistance.
If this scenario unfolds, the Ethereum price could revisit the October 3 low at $2,310. Furthermore, if the selling pressure increases and ETH/USD dips below the $2,310 mark, the downtrend can extend to the September 16 low at $2,250.
Please note that the bearish strategy should be invalidated if the ETH/USD rate exceeds $2,435.
Ethereum Bullish Scenario – 5-October-2024

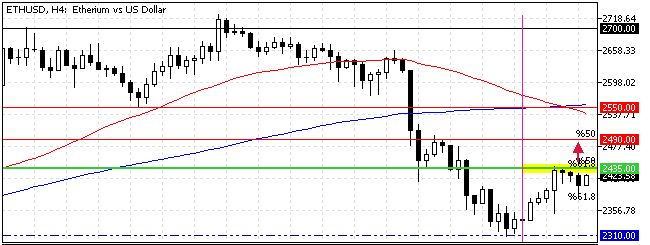
The critical resistance level rests at $2,435. If bulls (buyers) close and stabilize the Ethereum price above this mark, the bullish wave that began at $2,310 can potentially target the 50% Fibonacci retracement level at $2,490.
Furthermore, if the buying pressure pulls the price above the %50 Fibonacci, the next bullish barrier will be $2,550, the September 26 low.
- Also read: EUR/JPY Forecast – Bullish Above 163 Mark
Ethereum Support and Resistance Levels – 5-October-2024
Traders and investors should closely monitor the key levels below to make informed decisions and adjust their strategies accordingly as market conditions shift.
- Support: $2,319 / $2,250
- Resistance: $2,490 / $2,550