This short article provides Ethereum technical analysis, highlighting key trends, potential price changes, and important market indicators.
Ethereum Technical Analysis – Weekly Review
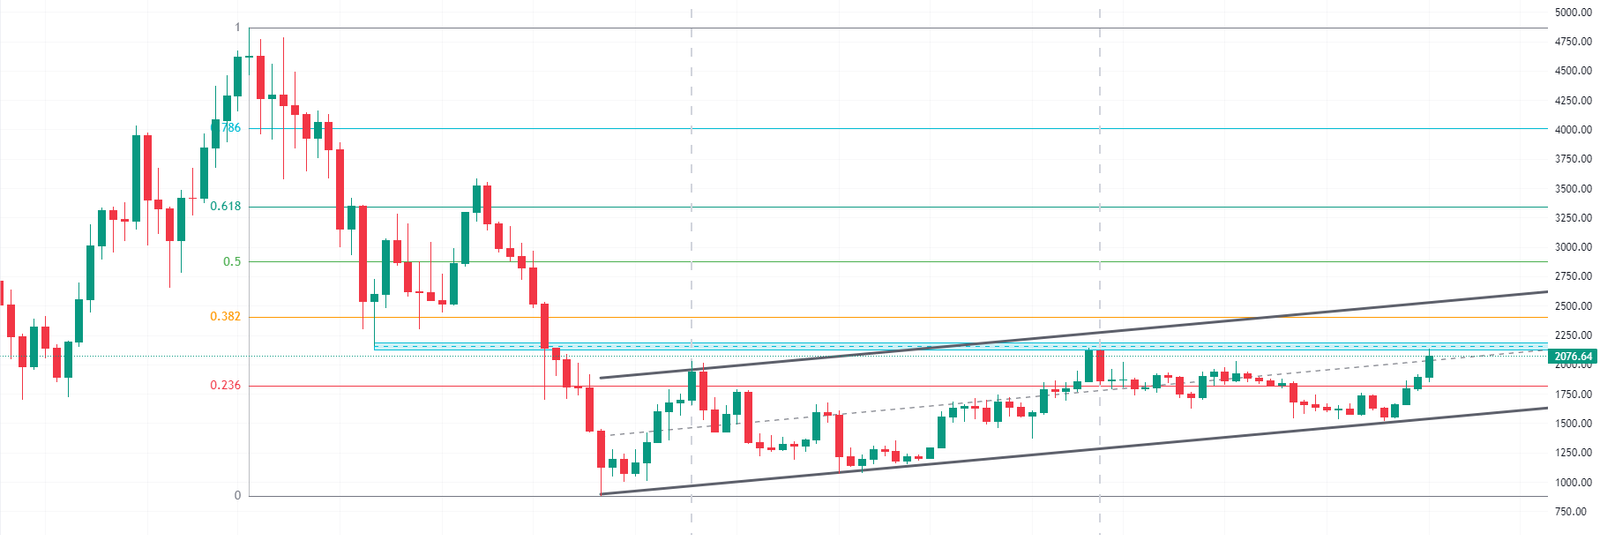
Here’s the ETHUSD weekly chart. The uptick momentum on Ethereum has extended to the key resistance level of $2,120. While the pair is trading within the weekly bullish channel, the price has reacted negatively to the $2,120 barrier twice – once in early August 2022 and then in mid-April 2023.

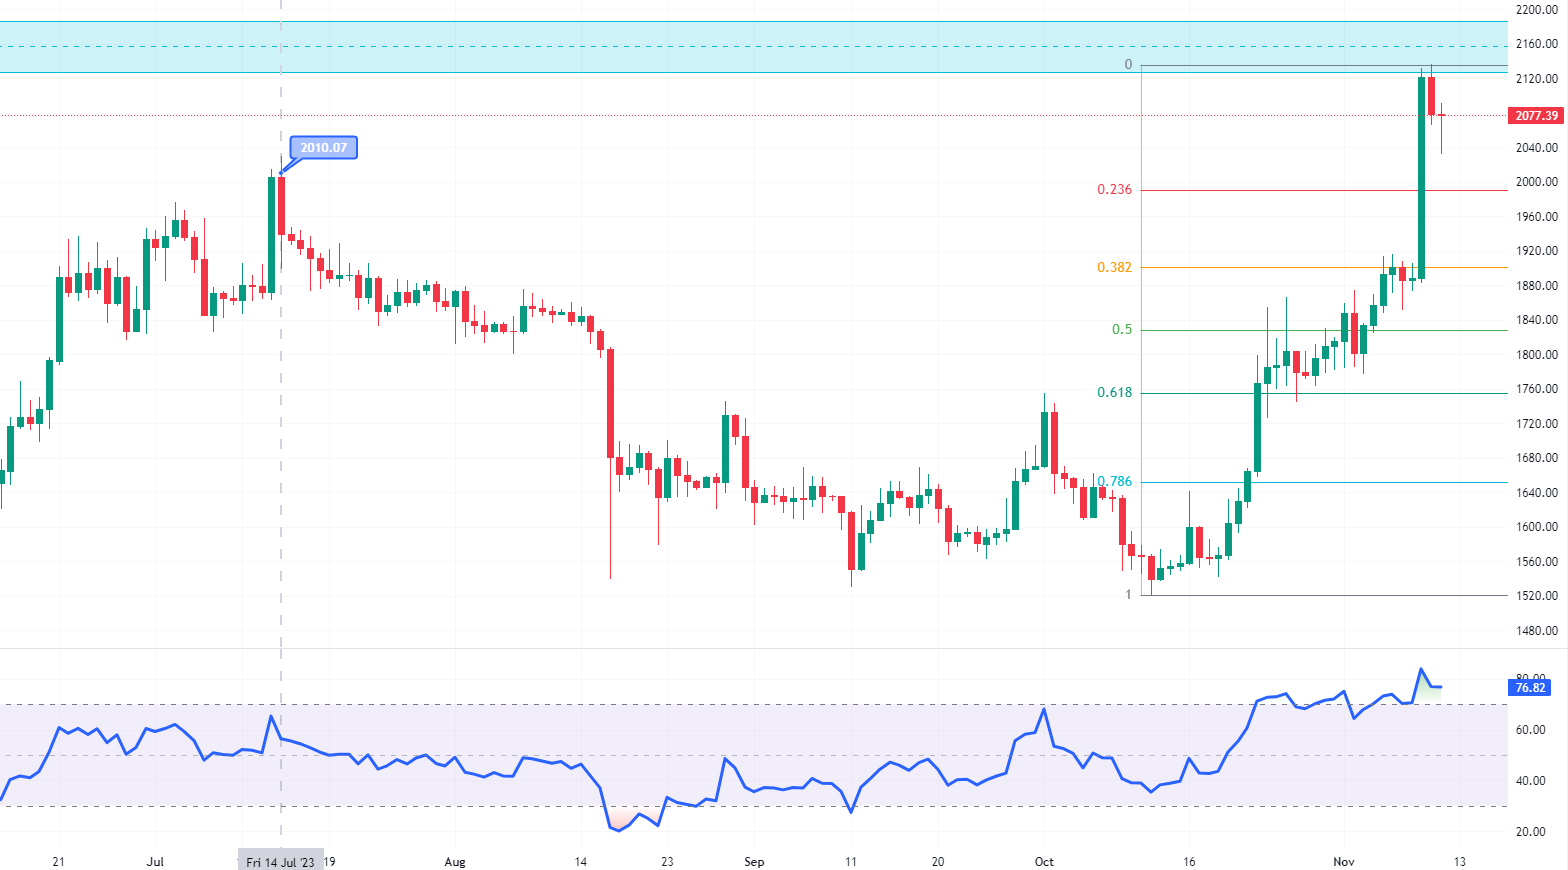
Let’s zoom into the daily chart to gain a better insight into ETHUSD price action. The RSI indicator shows that the market is saturated with bullish pressure. This signal, coupled with the significance of the $2,120 resistance, might lead the ETH price to correct some recent gains to the 23.6% Fibonacci retracement level, which coincides with July’s high of around $2,010.

Analysts at FxNews suggest waiting for the ETHUSD price to drop to the 23.6% Fibonacci and advise against buying the pair at the current price. A close above the weekly resistance is the next price action that could trigger buying pressures for the pair.
This Ethereum Technical analysis aims to provide you with the latest price action of the pair, along with tips and tricks on dissecting the market in detail and making informed decisions.