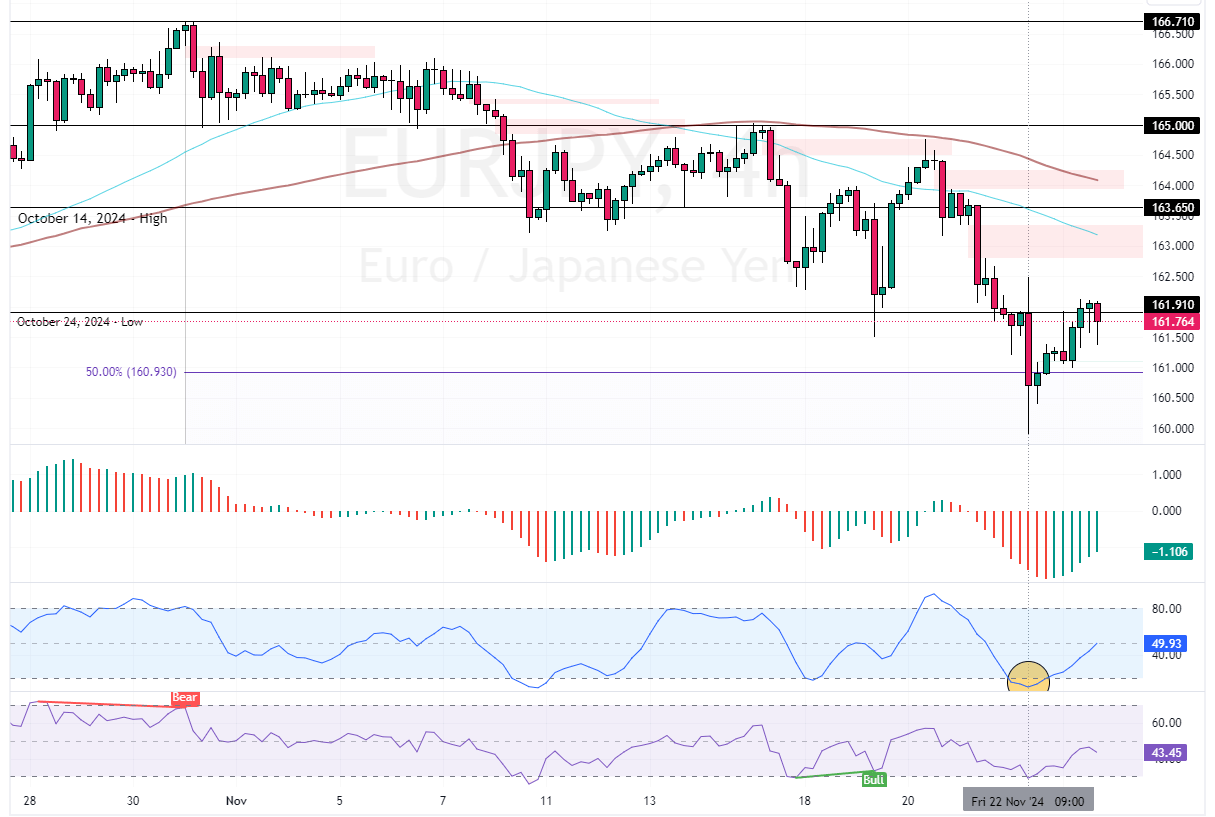
FxNews—The EUR/JPY primary trend is bearish because the prices are below the 50-period simple moving average. However, if we look at the daily chart, we notice the currency pair bounced from the 61.8% Fibonacci level (159.5), which is active support.
As of writing, EUR/JPY trades at approximately 161.9, testing the October 24 low as resistance.

EURJPY Technical Analysis
As for the technical indicators, Stochastic promised the current uptick in momentum since it signaled an oversold market on Friday, November 22. Additionally, the RSI 14 is below the median line, meaning the bear market should prevail. On the other hand, the values of Stochastic and Awesome Oscillator are rising, indicating the bear market is weakening.

Overall, the technical indicators suggest that while the primary trend is bearish, EUR/JPY could experience a bullish wave extending to upper resistance levels.
EURJPY Aims for 163.0 as Key Support Holds
The EUR/JPY’s immediate resistance is 161.91 (October 23—Low). From a technical perspective, the current uptick momentum in the EUR/JPY pair could resume if prices hold above the 50% Fibonacci support level at 160.9. In this scenario, the next bullish target could be 163.65, backed by the 50-period simple moving average.
On the other hand, if EUR/JPY dips below the immediate support at 160.93, the downtrend will resume. If this scenario unfolds, the price could revisit the 160.0 mark, followed by the 78.6% Fibonacci support level at 157.63.