FxNews—European stock markets saw a slight boost on the first trading day of November, with both the STOXX 50 and STOXX 600 indices rising by 0.2%. This uptick provided a much-needed break after three days of losses and an almost 3% decline in October—their biggest monthly drop in a year.

Traders are closely watching new corporate earnings and economic updates. Positive results from companies like Amazon and Intel have helped lift market spirits. Meanwhile, investors eagerly await the U.S. jobs report, which is due later today.
After three days of heavy selling, European equities are set for a positive opening on Friday as market sentiment stabilizes. Investors are reassessing the region’s economic conditions and monetary policies. Earlier in the week, disappointing earnings from major U.S. tech firms weighed on the markets.
Eurozone Inflation Surges Ahead of U.S. Election
Additionally, investors are preparing for the upcoming U.S. presidential election and the Federal Reserve’s policy decision next week. However, there are concerns after data released on Thursday showed that inflation in the Eurozone increased more than expected to 2%.
This rise in inflation could make it harder for the European Central Bank to cut interest rates further. In pre-market trading, the Euro Stoxx 50 and STOXX 600 futures were up by 0.1% and 0.15%, respectively.
EURJPY Technical Analysis 1-November-2024

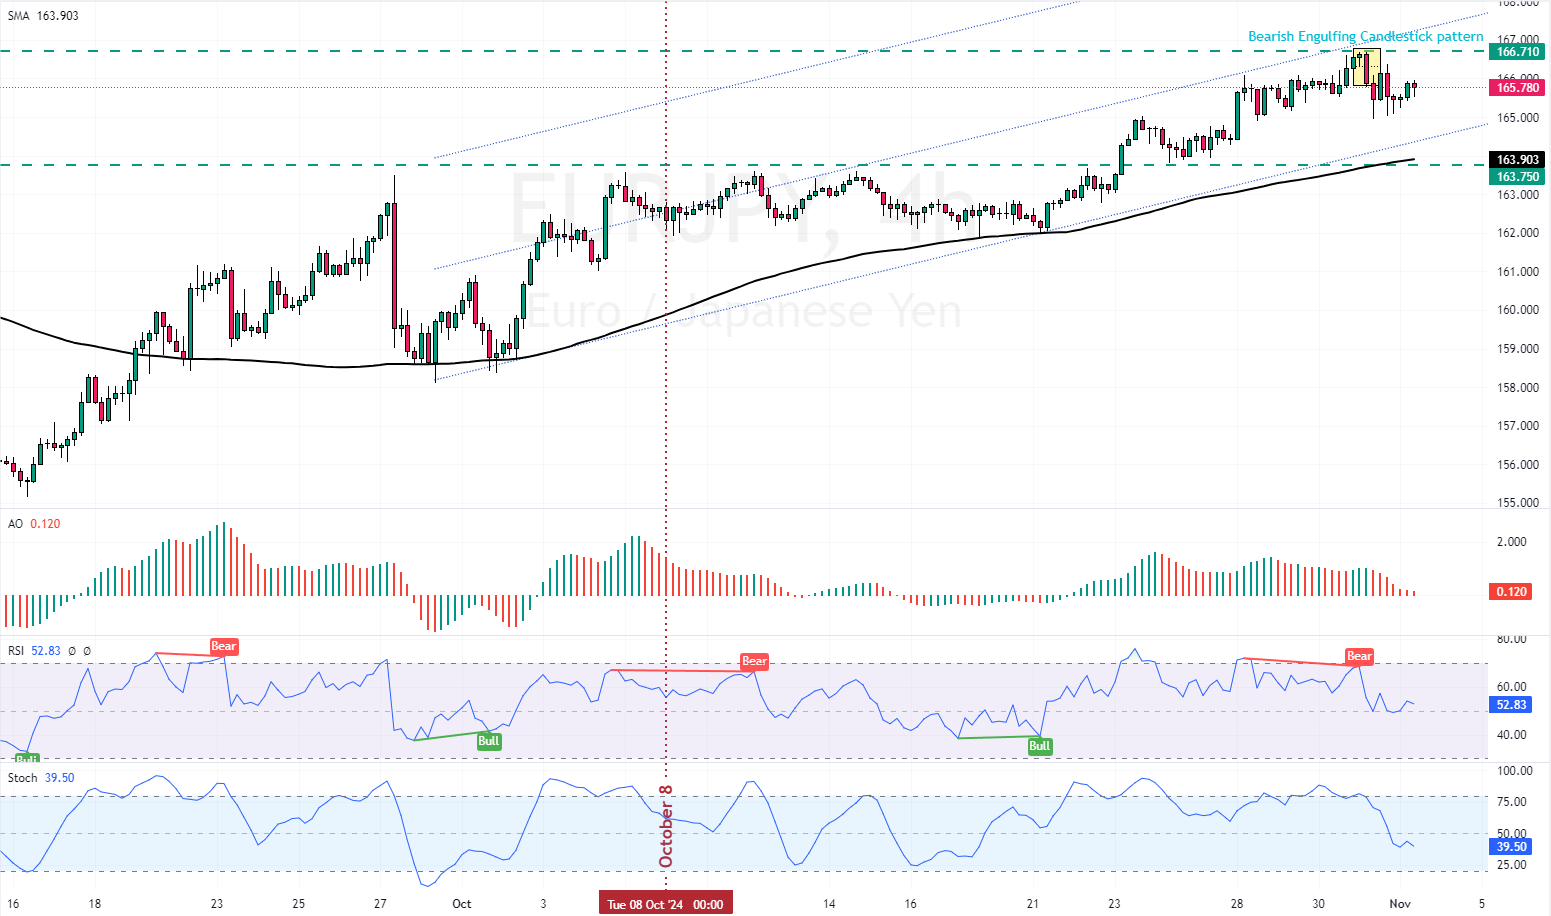
The European currency trades bullish against the Japanese Yen, above the 50- and 100-period simple moving averages at approximately 165.8. The currency pair experienced a slight decrease from 166.71, which was expected because the RSI 14 signaled a bearish divergence, backed by the bearish engulfing candlestick pattern.
Other technical indicators include the Awesome Oscillator histogram, which is red and nearing the signal line, and the Stochastic Oscillator, which is declining, meaning the bear market is strengthening.
Overall, the technical indicators suggest while the primary trend is bullish, traders should be cautious because the price might dip and test the lower support levels.

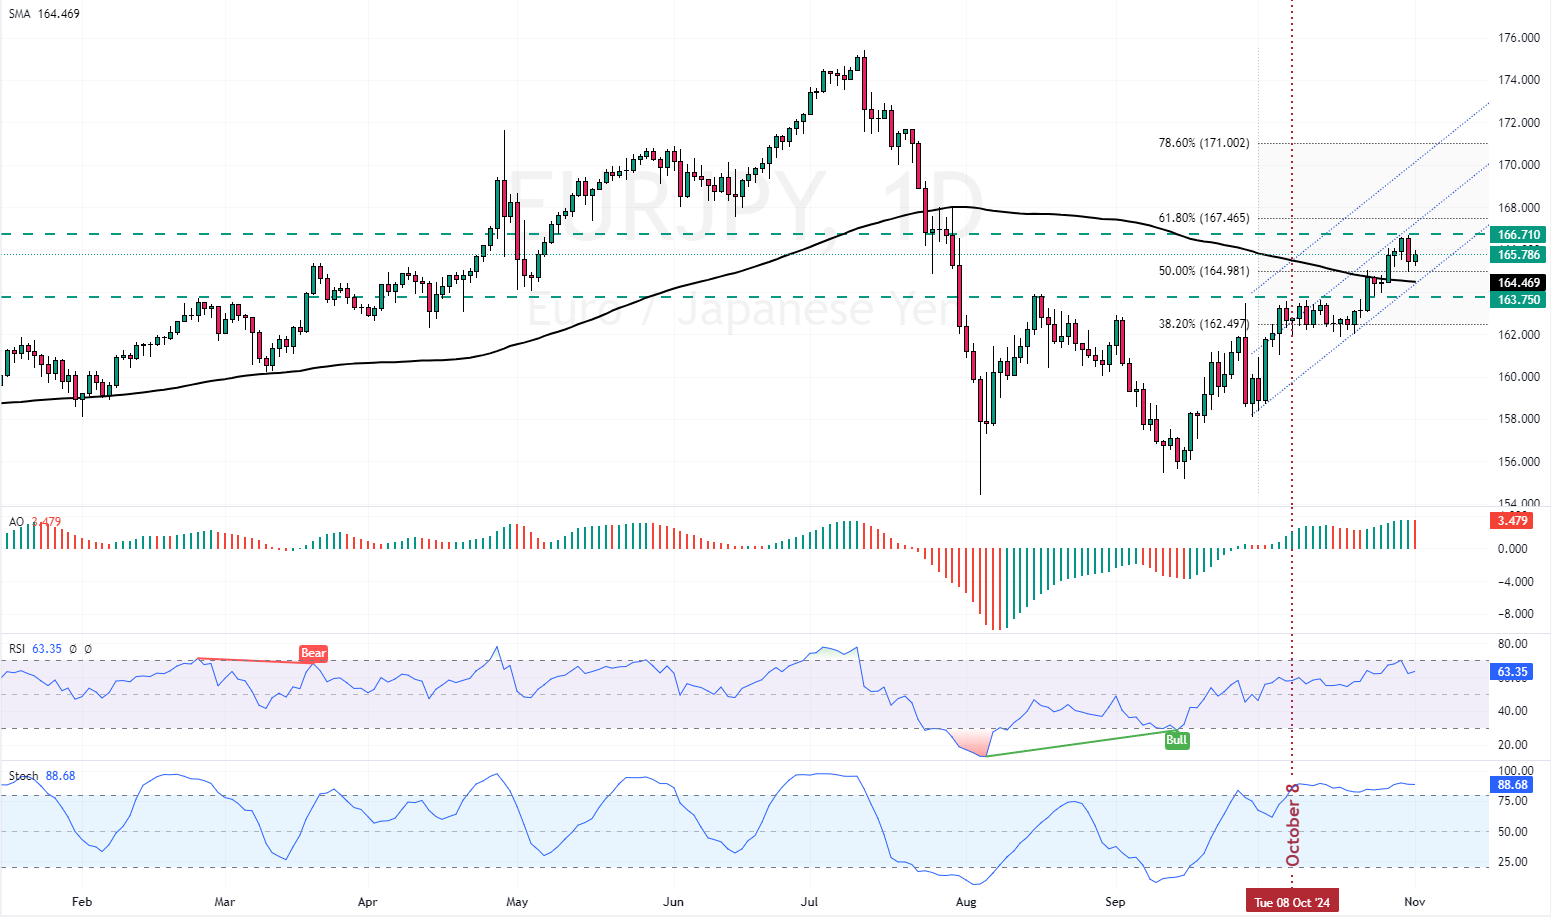
The bearish outlook is augmented by the EUR/JPY daily chart, where the Stochastic Oscillator has been signaling overbought since October 8.
EURJPY Forecast – 1-November-2024
The immediate resistance rests at 166.7, the October 30 high, which is backed by the middle line of the bullish flag. From a technical perspective, if the EUR/JPY price closes above 177.71, the bullish trend will likely resume. In this scenario, the next bullish target could be the 61.8% Fibonacci retracement level at 167.46.
The critical support for the bull market is at 163.75, backed by the 100-period simple moving average. Please note that the bullish trend should be invalidated if EUR/JPY falls below 163.75.
Bearish Scenario
If bears (sellers) close and stabilize the EUR/JPY price below the 163.75 mark, a new bearish wave will likely form that could target the October 17 low at 161.9.
Key Support and Resistance Levels
Traders and investors should closely monitor the key levels below to make informed decisions and adjust their strategies accordingly as market conditions shift.
- Support: 163.75 / 161.91
- Resistance: 166.71 / 167.46