Fxnews—In today’s comprehensive EURSGD forecast, we will first examine the current economic conditions in Singapore and then meticulously analyze the EURSGD pair’s technical analysis.
Singapore Retail Sales Slow Down
Bloomberg—In September 2023, Singapore experienced a deceleration in its retail sales growth, registering a modest 0.6% increase compared to last year. This represents the weakest growth since January, signaling a downturn from the previous month’s revised 4.2% rise. The slowdown was evident across various sectors, with notable dips in sales of supermarkets & hypermarkets, cosmetics, toiletries & medical goods, apparel & footwear, and optical goods & books.
There was a marked contraction in department stores, petrol service stations, and furniture and household equipment sectors. Conversely, certain areas such as food and alcohol, watches and jewelry, mini-marts and convenience stores witnessed an upturn in sales. Despite these mixed signals, the month-on-month data indicates a 1.6% decline in retail sales, suggesting a cautious consumer atmosphere.
The mixed performance across different retail sectors suggests that while the economy is not sharply contracting, it is certainly showing signs of reduced retail activity, pointing towards a potential slowdown in economic expansion.
Regarding whether the Singapore economy is expanding or shrinking based on retail sales data, it appears that the economy is facing some challenges that may signal a slowing expansion, particularly within the retail sector. While a single indicator such as retail sales is not definitive proof of the overall economic trend, it is an important measure of consumer confidence and spending, which are key drivers of economic growth.
EURSGD Technical Analysis and Forecast
The EURSGD currency pair is currently trading below the significant 1.46 support level. Despite the bulls’ attempt to break out of this level on the 23rd of October, their efforts were unsuccessful. This situation is depicted in our EURSGD forecast. A long-wick candlestick on the daily chart indicates that bearish sentiment is prevailing. As the EURSGD pair is trading below the Ichimoku cloud, it is advisable to seek selling opportunities.

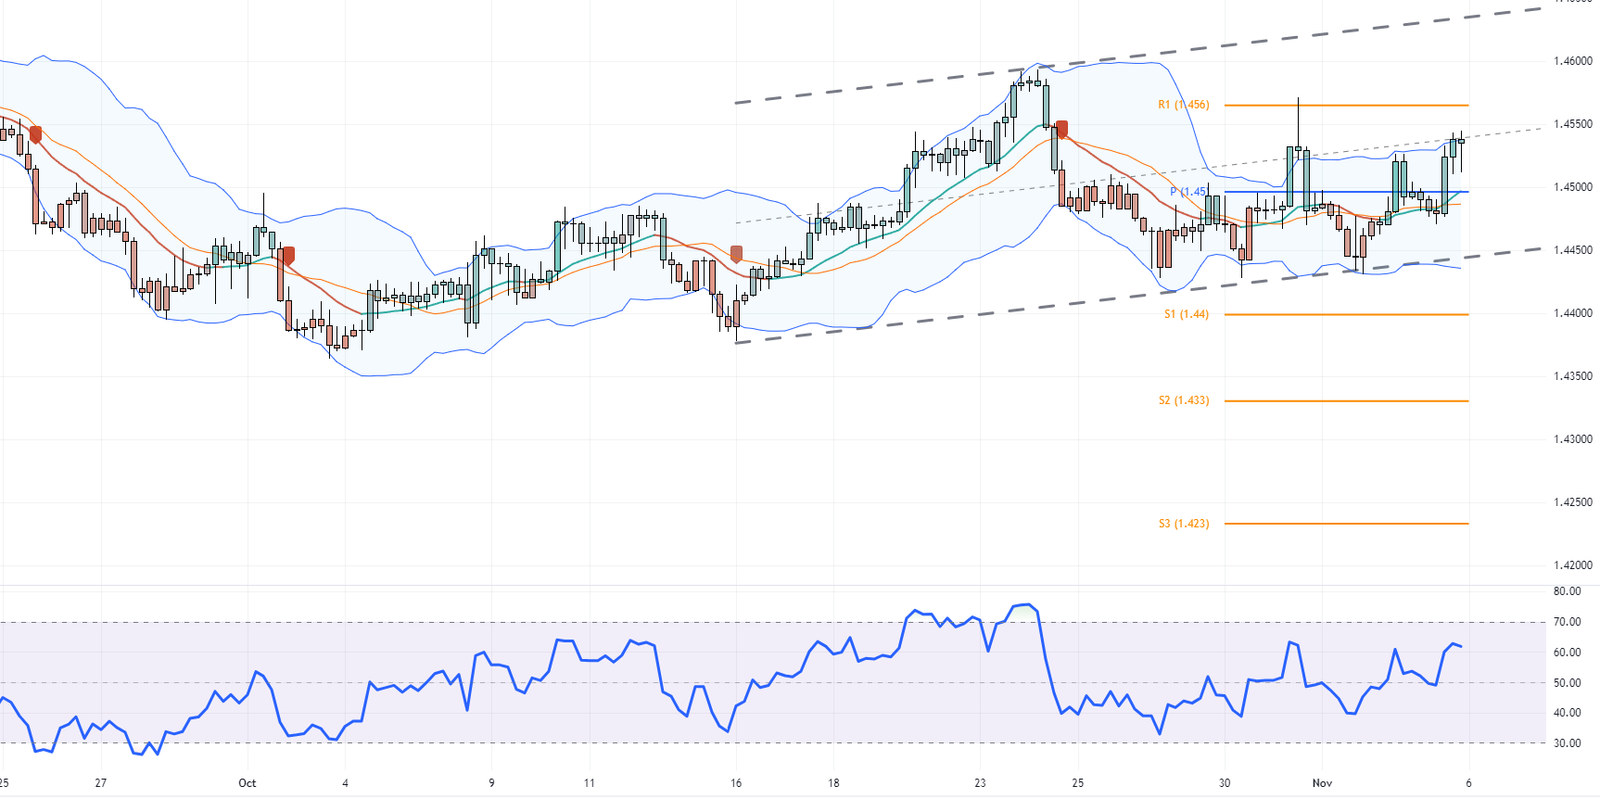
To gain a more detailed insight into the EURSGD forecast, we can examine the 4H chart. Here, the pair is trading within a bullish channel. With the RSI indicator hovering above the 50 level and the pair trading above the 1.45 pivot, it is plausible that the price could aim for the upper line of the bullish channel.

Therefore, waiting for the EURSGD bears to form a bearish engulfing pattern or a long-wick candlestick pattern near the resistance is recommended, or to break down the channel and close below S1. A close below S1 would pave the way to S2, followed by S3, per our EURSGD forecast.
FxNews analysts suggest keeping a close eye on these levels.