FxNews—The EUR/USD pair traded bearishly today, below the 50- and 100-period simple moving average at approximately $1.055. Traders are closely watching economic and monetary shifts and political developments in Germany.

The euro is under pressure because many expect the European Central Bank (ECB) to cut interest rates more aggressively than the US Federal Reserve. Meanwhile, the US dollar is gaining strength. This is partly due to forecasts that Donald Trump’s policies could raise inflation, limiting the Fed’s ability to lower borrowing costs.
Olaf Scholz Proposes Early German Election
The ECB is anticipated to reduce interest rates by 0.25% in December. Markets also predict that rates could drop to 2% by June. On the political front, German Chancellor Olaf Scholz has expressed willingness to advance the parliamentary vote of confidence before Christmas, potentially leading to an early election.
EURUSD Technical Analysis – 18-November-2024

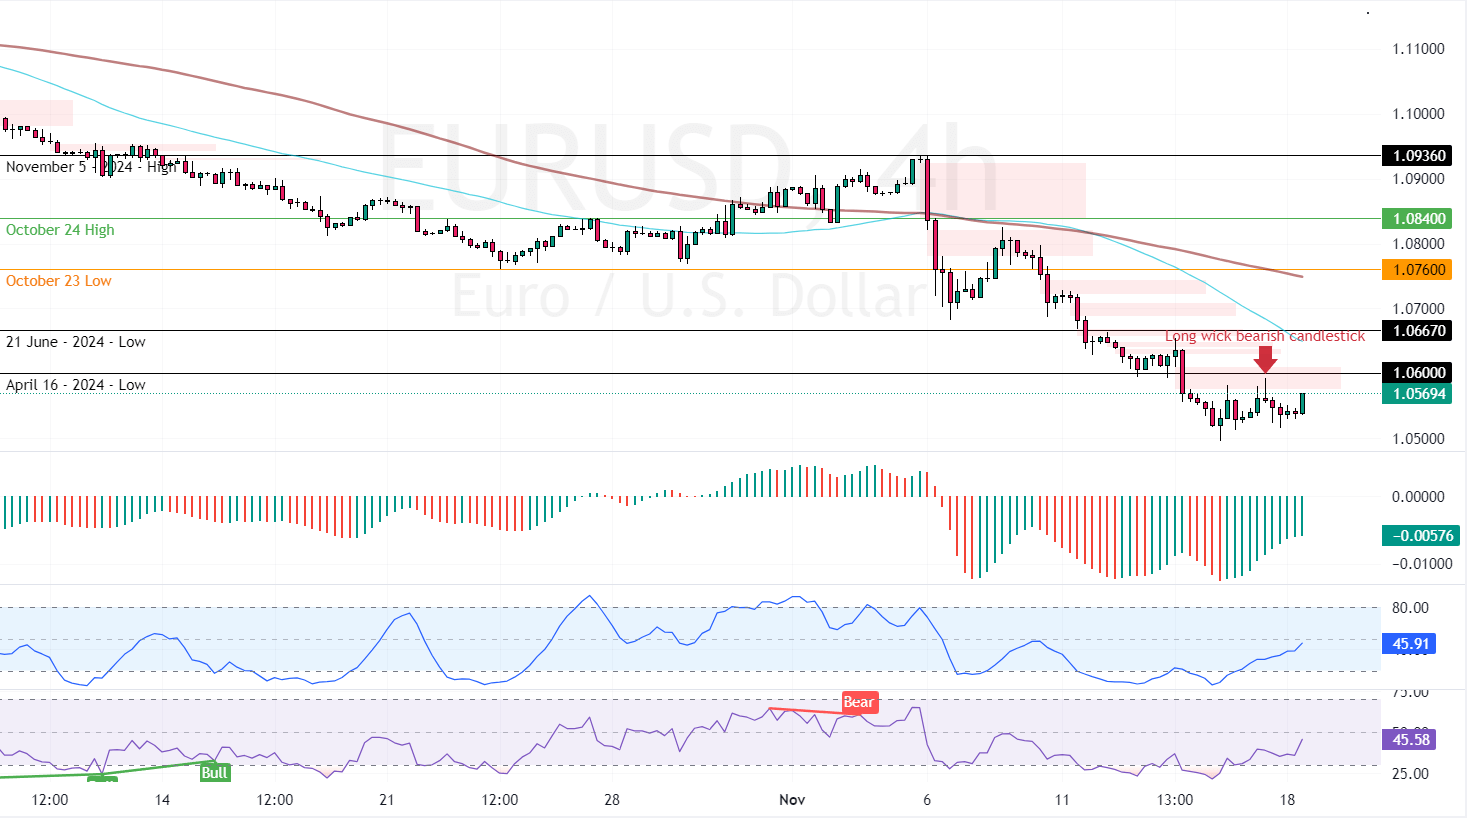
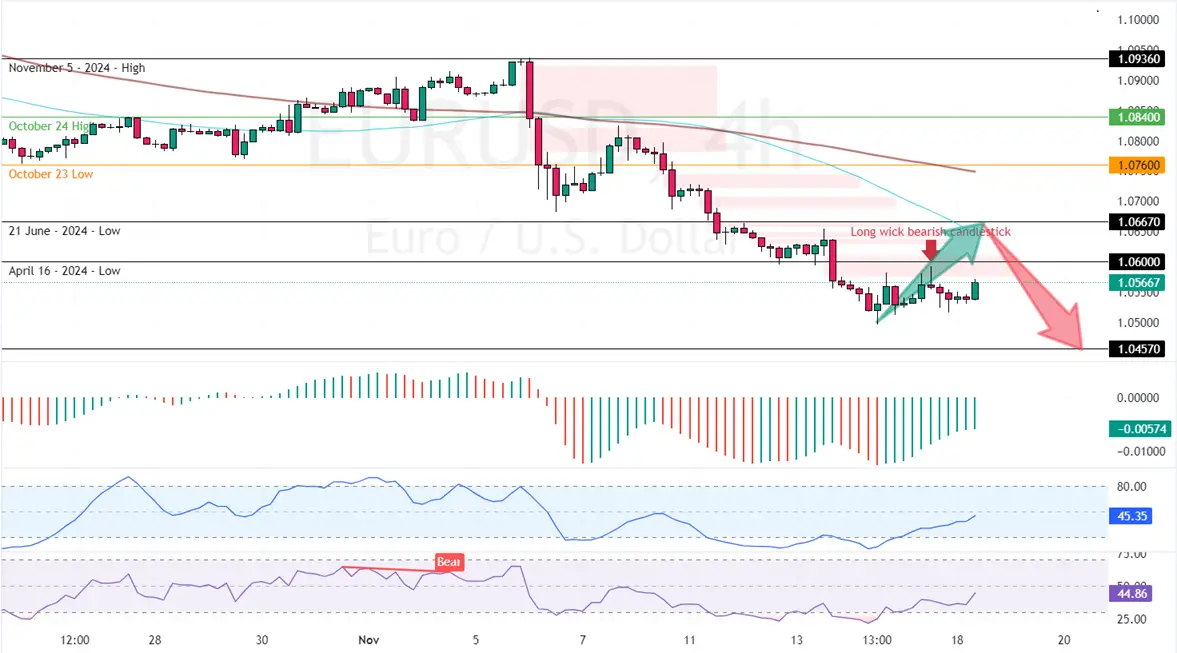
The immediate support is at $1.06 (April 16 Low). The bulls tested the 1.06 mark on Friday, resulting in the 4-hour chart forming a long-wick bearish candlestick pattern. But, the technical indicators demonstrate bullish momentum.
- RSI 14 depicts 44 in the description, rising toward the median line.
- The Stochastic records show 45.0, nearing 50.
- The Awesome Oscillator histogram is green but below zero.
Overall, the technical indicators suggest while the primary trend is bearish, the EUR/USD currency pair has the potential to rise and test the upper resistance levels.
EURUSD Forecast – 18-November-2024

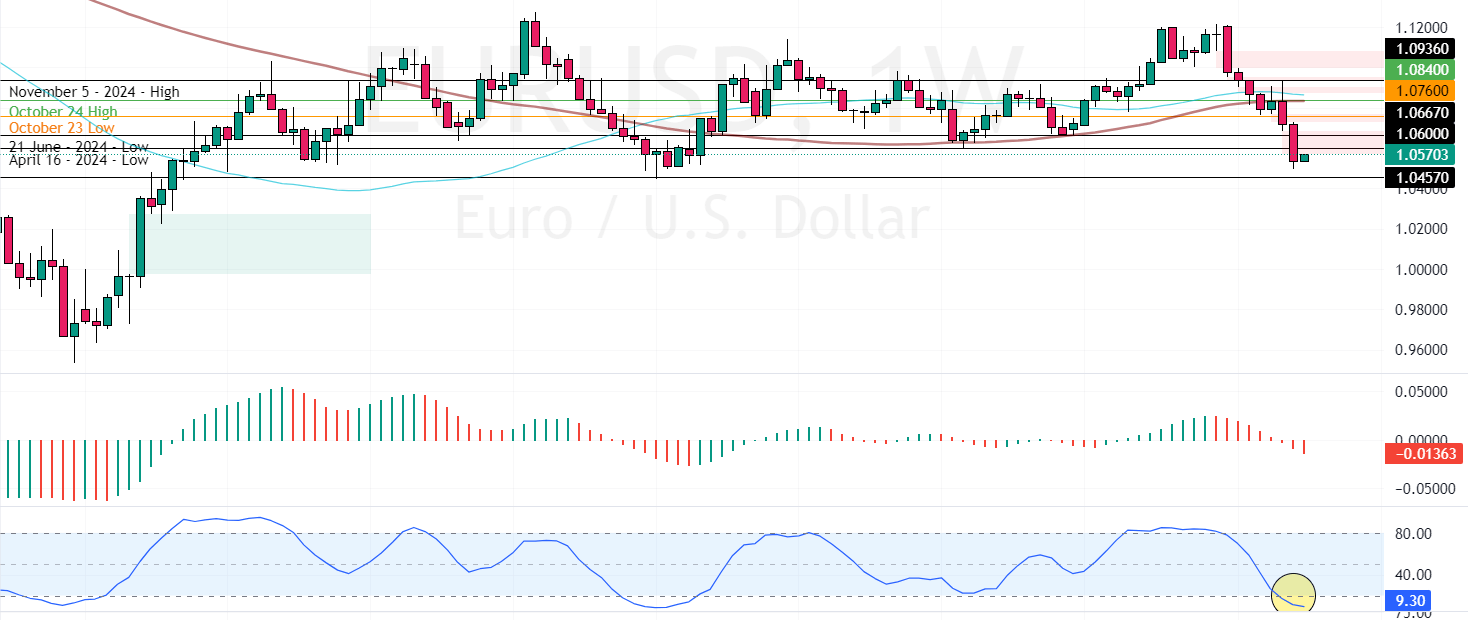
From a technical perspective, the EUR/USD trend outlook remains bearish as long as the prices are below the 50-period SMA, the 1.066 mark. Due to stochastic’s oversold signal in the weekly chart, the market expects a consolidation phase. Therefore, joining the bear market is not advisable if it is saturated with sellers.
- Also read: EUR/JPY Eyes New Lows Below 165.0 Mark
That said, traders and investors should monitor the 1.066 resistance closely for bearish signals, such as candlestick patterns.
Overall, if the 1.06 resistance holds firm, the next bearish target could be the October low at 1.045.