FxNews—The EUR/USD sharp downtrend eased near the 61.8% Fibonacci retracement level at $1.072. The bearish trajectory drove the RSI and the stochastic oscillator into the oversold area, which could mean the trend is exhausted from selling pressure and might step into a consolidation phase.
The EUR/USD 4-hour chart below demonstrates the Fibonacci levels, technical indicators, and the moving averages that will be utilized in today’s technical analysis.

EURUSD Technical Analysis – 12-June-2024
The 4-hour chart shows that the pair trades in a narrow bearish channel, meaning bearish momentum prevails. The technical indicators also suggest the primary trend is bearish, but the Euro is oversold against the U.S. Dollar.

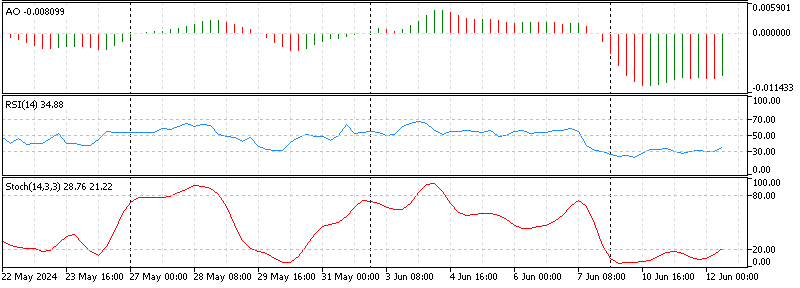
- The awesome oscillator value is -0.008, with red bars below the signal line. This means the primary trend is bearish, and the downtrend will likely resume.
- The relative strength index (RSI) stepped out of oversold territory, depicting 34 in the description. This growth in the RSI (14) indicates that the bearish momentum is cooling.
- The stochastic oscillator has been hovering in the oversold territory since the beginning of the week. Recording 20 as of writing, signifying the EUR/USD oversold is extreme.
EURUSD Forecast – 12-June-2024

The immediate resistance is the 61.85 Fibonacci level at $1.072, which has been holding. The technical indicators suggest an oversold market; therefore, the price might bounce from $1.072. For this scenario to unfold, the Euro must surpass the descending trendline in conjunction with the 50% Fibonacci level at $1.075.
If this occurs, the EUR/USD price could test this week’s high at $1.077, followed by the 38.2% Fibonacci level at $1.079.
Please note that the primary trend is bearish. Therefore, if the price reaches $1.079, traders and investors should monitor this level for bearish trading signals to join the primary trend.
Bearish Scenario
The key resistance level is the 61.8% Fibonacci mark at $1.072. If the EUR/USD price exceeds this resistance, the bears’ road to the 78.6% Fibonacci at $1.066 will be paved.
EURUSD Key Support and Resistance Levels
Traders and investors should closely monitor the key levels below to make informed decisions and adjust their strategies accordingly as market conditions shift.
- Support: 1.072 / $1.066
- Resistance: $1.075 / $1.077 / $1.079