FxNews—The European currency is consolidating in a mild downtrend at about $1.1 psychological level against the U.S. Dollar. As of this writing, the EUR/USD price exceeds the abovementioned resistance at about $1.105.
The 4-hour chart below demonstrates the price, critical support and resistance levels, and indicators used in today’s analysis.

EURUSD Technical Analysis – 12-September-2024

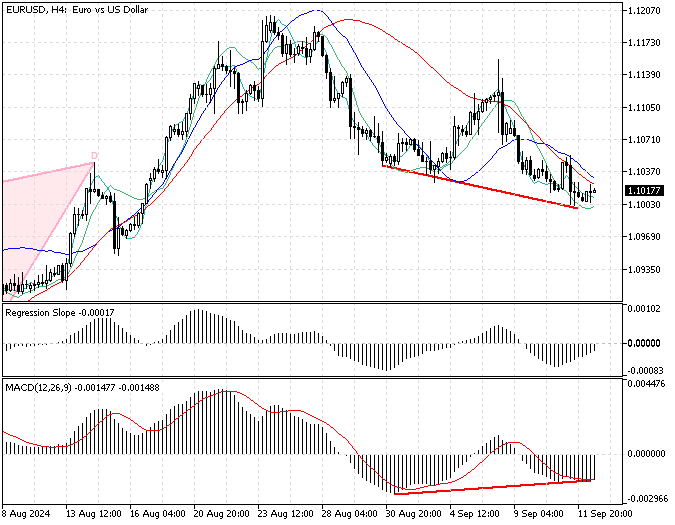
We notice the price is below the 50- and 100-period simple moving averages, indicating a bear market. But the Stochastic oscillator has stepped outside the oversold territory, signaling a bullish wave could be on the horizon.
- The Awesome oscillator bars are red, long, and below the signal line, meaning the primary trend is bearish.

Interestingly, the MACD indicator signals divergence, which suggests that the EUR/USD price can potentially rise and test the upper resistance levels.
Overall, the technical indicators suggest the primary trend is bearish, but the price could bounce from $1.1, and the upper resistance zones could be tested.
EURUSD Forecast – 12-September-2024

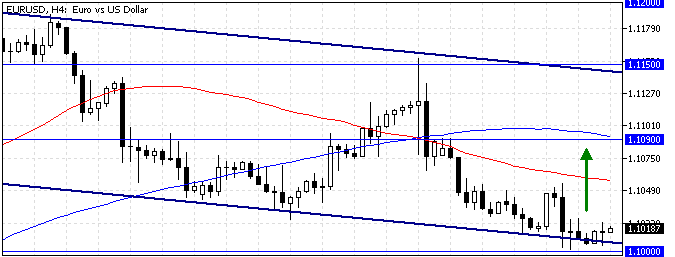
The critical support level for the current downtrend is $1.1 (August 5 Low). From a technical perspective, the EUR/USD price can rise and test $1.109 (August 21 Low) as resistance if the bulls maintain their position above $1.1.
Please note that the $1.109 level is backed by the 100-period simple moving average, which makes it a robust resistance level. Furthermore, if the buying pressure exceeds $1.109, the next resistance will be the September 6 high at $1.115, backed by the descending trendline.
EURUSD Bearish Scenario – 12-September-2024

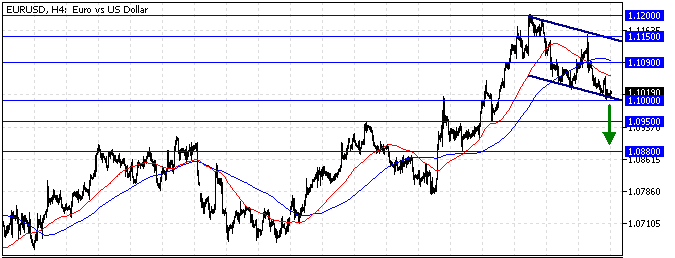
The downtrend that began at 1.12 will likely be triggered again if the bears (sellers) push the EUR/USD exchange rate below the psychological $1.1 level. If this scenario unfolds, the next bearish target could be the August 15 low at 1.095.
Furthermore, if the selling pressure exceeds 1.095, the next supply zone will be 1.088, which is low on August 8.
EURUSD Support and Resistance Levels – 12-September-2024
Traders and investors should closely monitor the key levels below to make informed decisions and adjust their strategies accordingly as market conditions shift.
- Support: $1.1 / $1.095 / $1.088
- Resistance: $1.109 / $1.115 / $1.12