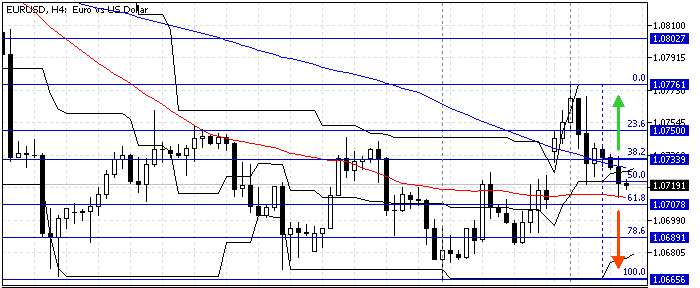
FxNews—The euro trades in a downtrend against the U.S. Dollar at approximately $1.071 in today’s session. In a recent development, the dollar flipped below the 100-period simple moving average and the median line of the Donchian channel indicator, meaning the downtrend is triggered again.
The EUR/USD 4-hour chart below demonstrates the current price, the Fibonacci key levers, and the technical indicators employed in today’s analysis.

EURUSD Technical Analysis – 2-July-2024
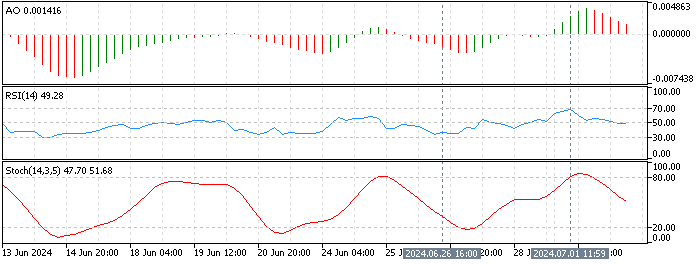
The technical indicators in the EUR/USD 4-hour chart suggest that the primary trend is bearish and will likely resume, targeting the lower supply levels.

- The awesome oscillator bars are in red, recording 0.0018 in the description and decreasing. The drop in the AO value interprets as the downtrend prevails.
- The relative strength index indicator also dips. The RSI 14 value currently hovers around the median line, signifying that the market is neither bullish nor bearish and that the downtrend could resume.
- The stochastic oscillator has exited the overbought territory, showing a value of 57 in the description, suggesting that the bearish momentum is gaining strength.
EURUSD Forecast – 2-July-2024

The immediate support is at the 50% Fibonacci level in the 4-hour chart. From a technical standpoint, bears (sellers) should close the candle in the 4-hour time frame for the downtrend to resume. If this scenario comes into play, the dip from the July 1 high at $1.077 could extend to the 78.6% Fibonacci at $1.068.
Furthermore, if the selling pressure dips below $1.068, the next supply zone will likely be the June 26 low at $1.066. Please note the 38.2% Fibonacci at $1.073 is the key resistance to the bearish scenario. If the bulls (buyers) exceed $1.073, the selling strategy should be invalidated accordingly.
EUR/USD Bullish Scenario – 2-July-2024
The immediate resistance is at $1.073, the 38.2% Fibonacci level. If the bulls (buyers) push and close the price above this resistance, the bullish momentum initiated on June 26 from $1.066 could retest yesterday’s high at $1.077.
Furthermore, if the buying pressure exceeds $1.077, the next resistance level to watch will be $1.080. Notably, the 61.8% Fibonacci at 1.070 is the key support to the bullish strategy. Should the bears dip the price below $1.07, the bullish scenario should be invalidated.
EUR/USD Key Support and Resistance Levels
Traders and investors should closely monitor the key levels below to make informed decisions and adjust their strategies accordingly as market conditions shift.
- Support: $1.070 / $1.068 / $1.066
- Resistance: $1.073 / $1.075 / $1.077