FxNews—Euro failed to maintain its bullish momentum against the U.S. dollar in today’s trading session. The EUR/USD currency pair dipped when the price neared the August 26 high at $1.12.
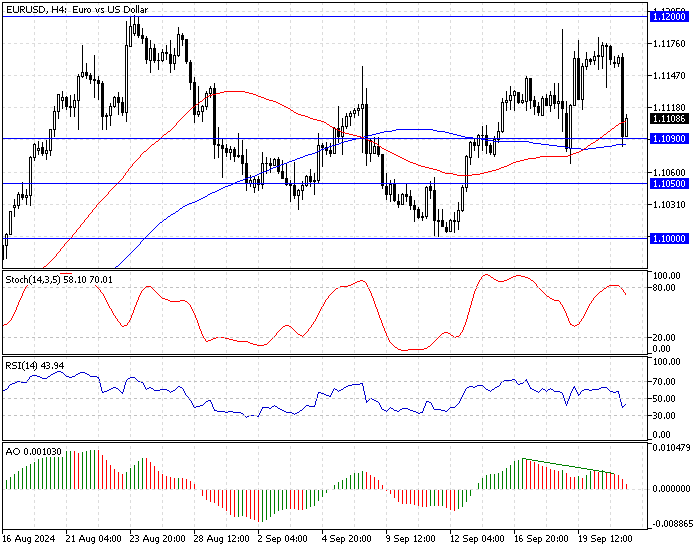
As of this writing, the trading product in discussion trades at approximately $1.111, testing the 100-period simple moving average as resistance.
The daily chart below demonstrates the price, support, resistance levels, and technical indicators used in today’s analysis.

EURUSD Technical Analysis – 23-September-2024

The euro’s decline began an hour ago and is testing the 100-SMA, which neighbors the September 19 low at 1.109. The Awesome oscillator signals divergence, while the histogram is red and approaching the zero line from above, meaning the bear market is strengthening.
The relative strength index and Stochastic are declining, showing 43 and 70 in the description, respectively, indicating that the bear market is gaining more momentum.
Overall, the primary trend is bullish because the price is above the 50- and 100-period moving averages, but the EUR/USD price could consolidate near the lower support levels.
EURUSD Forecast – 23-September-2024

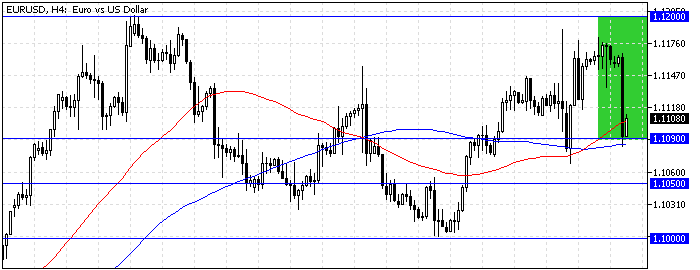
The main trend direction is bullish, with immediate support at 1.109. If the bulls maintain the value of the EUR/USD pair above $1.109, the uptrend will likely be triggered again. In this scenario, the bulls will likely target the August 2024 high at $1.12.
Furthermore, if the buying pressure results in the price exceeding 1.12, the next bullish barrier will be the July 2023 peak at 1.128.
Kindly note the 100-period simple moving average supports the bullish scenario, and it should be invalidated if the EUR/USD rate falls below 1.109
- Also read: GBP/JPY Forecast – 23-September-2024
EURUSD Bearish Scenario – 23-September-2024

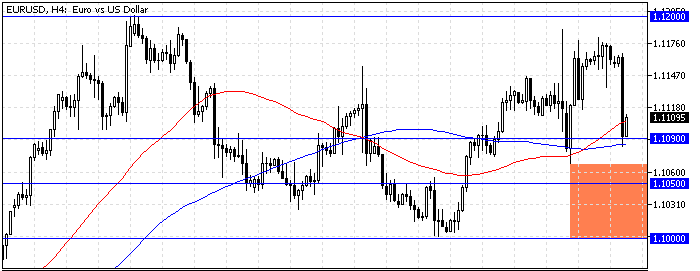
If the bears (sellers) push the EUR/USD price below 1.109, the downtick momentum that began today will likely spread to the next support area at 1.105, the August 14 high.
Furthermore, if the selling volume increases and the EUR/USD crosses below 1.105, the support level will be 1.095, and August 8 will be low.
EURUSD Support and Resistance Levels – 23-September-2024
Traders and investors should closely monitor the key levels below to make informed decisions and adjust their strategies accordingly as market conditions shift.
- Support: 1.109 / 1.105 / 1.10 / 1.095
- Resistance: 1.12 / 1.128