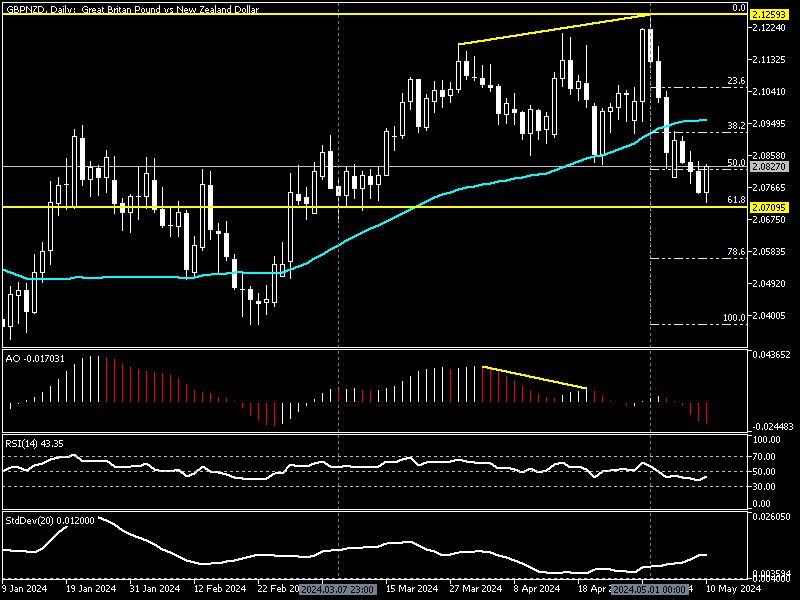
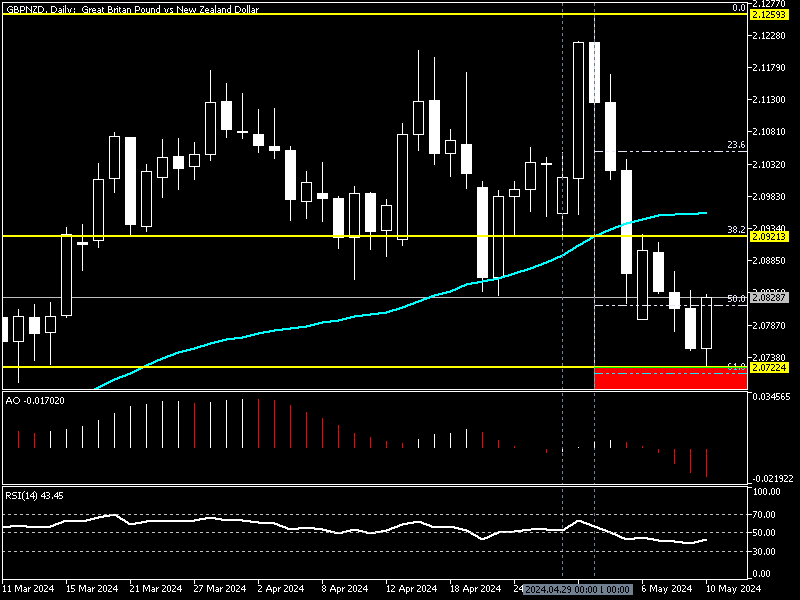
FxNews—The pound sterling’s value against the New Zealand dollar significantly declined from 2.12, May 2024’s all-time high. The downtrend eased after the GBPNZD exchange rate dropped to 2.07, which neighbors the %61.8 Fibonacci retracement level.
As of writing, the price bounced from 2.07 and trades slightly above the %50 Fibonacci at about 2.08. The downtrend that began on May 1 was likely since the awesome oscillator signaled divergence. The daily chart above shows the GBPNZD Fibonacci levels and the divergence signal in the AO indicator.
GBPNZD Technical Analysis
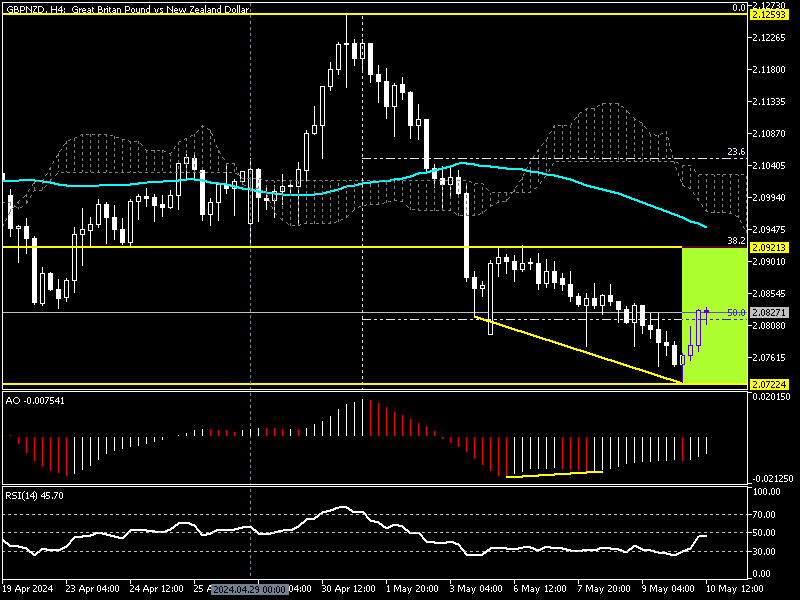
The technical indicators in the 4-hour chart promise a continuation of today’s uptick momentum that began from 2.07. The awesome oscillator bars are green, and interestingly, they signal divergence, a sign of an imminent trend reversal or the beginning of a consolidation phase.

The relative strength index (RSI) hovers around 45.0, approaching the median line. This also indicates the bullish momentum in the GBPNZD pair.
In conclusion, AO and RSI signal the current pull-back from the %61.8 Fibonacci retracement level might grow higher.
GBNZD Forecast – The Pullback Hinges on 2.07
The primary trend is bearish because the GBPNZD price is below EMA 50 and Ichimoku Cloud. However, the technical indicators promise that today’s pullback will extend further. Traders and investors should know that each market steps into a consolidation phase before the main trend resumes.

Therefore, from a technical standpoint, the 2.07 mark supports today’s pullback. If the bulls maintain a position above this level, the GBPNZD price can recover from some of its recent losses. In this case, the pullback will likely expand to %38.2 Fibonacci resistance (2.09), a barrier that neighbors the April 29 low.
It is worth mentioning that the EMA 50 and the Ichimoku cloud are fueling the 2.09 resistance. Thus, based on the primary trend, which is bearish, this demand area can deliver a decent entry point for forex traders or investors to join the bear market. That said, analysts at FxNews recommend monitoring the 2.09 mark closely for selling signals, such as an overbought RSI or bearish candlestick patterns.
GBPNZD Bulls Challenges to Effective Pull-back
As explained earlier in this article, the 2.07 mark, in conjunction with the 61.8% Fibonacci level, plays the support, a deck that stopped the selling pressure. Should the GBPNZD price dip below 2.07, the pull-back analysis should be invalidated, and the downtrend will likely extend to the %78.6 Fibonacci retracement, the 2.056 mark.

