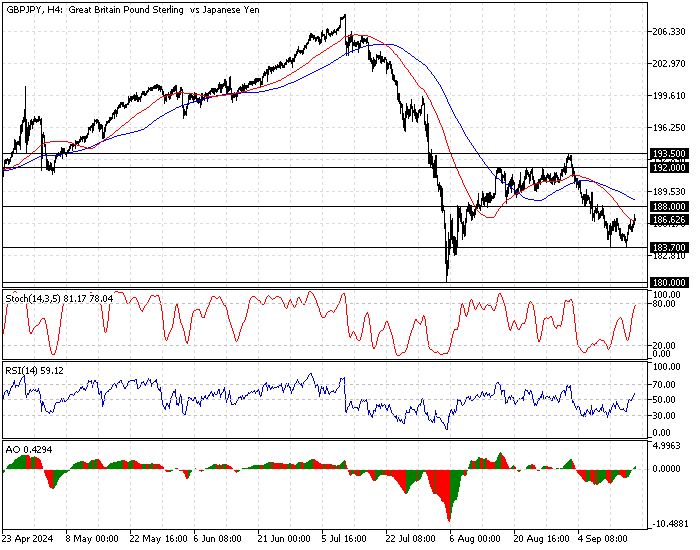
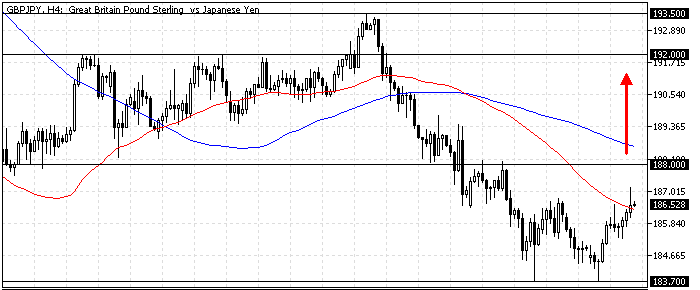
FxNews—The British pound is consolidating against the Japanese yen at approximately 186.5, testing the 50-period simple moving average as resistance.
The GBP/JPY 4-hour chart below demonstrates the price, support, resistance levels, and technical indicators used in today’s analysis.

GBPJPY Technical Analysis – 17-September-2024
The Awesome oscillator bars are green and flipped above the signal line, meaning the bull market strengthens. Additionally, the relative strength index and the stochastic oscillator show 58 and 78 in the description, signifying the bearish pressure weakens.
Overall, the primary trend of the technical indicators is bearish, but it can reverse from a bear market to a bull market.
- Next read: GBPJPY Forecast – 23-September-2024
GBPJPY Forecast – 17-September-2024

The August 19 low of 188.0 is the immediate resistance and neighbors the 100-period simple moving average. From a technical standpoint, the uptick momentum from 188.7 can potentially extend to 192.0 if the bulls close and stabilize the price above 188.0.
Furthermore, if the buying pressure exceeds 192.0, the next resistance level will be 193.5, the September 2 high.
GBPJPY Bearish Scenario
If the bears (sellers) close and stabilize the price below the immediate support at 183.7, the downtrend will be triggered again. In this scenario, the decline can extend to the August 2024 low at 180.0.
GBPJPY Support and Resistance Levels
Traders and investors should closely monitor the key levels below to make informed decisions and adjust their strategies accordingly as market conditions shift.
- Support: 183.7 / 180.0
- Resistance: 188.0 / 192.0 / 193.5