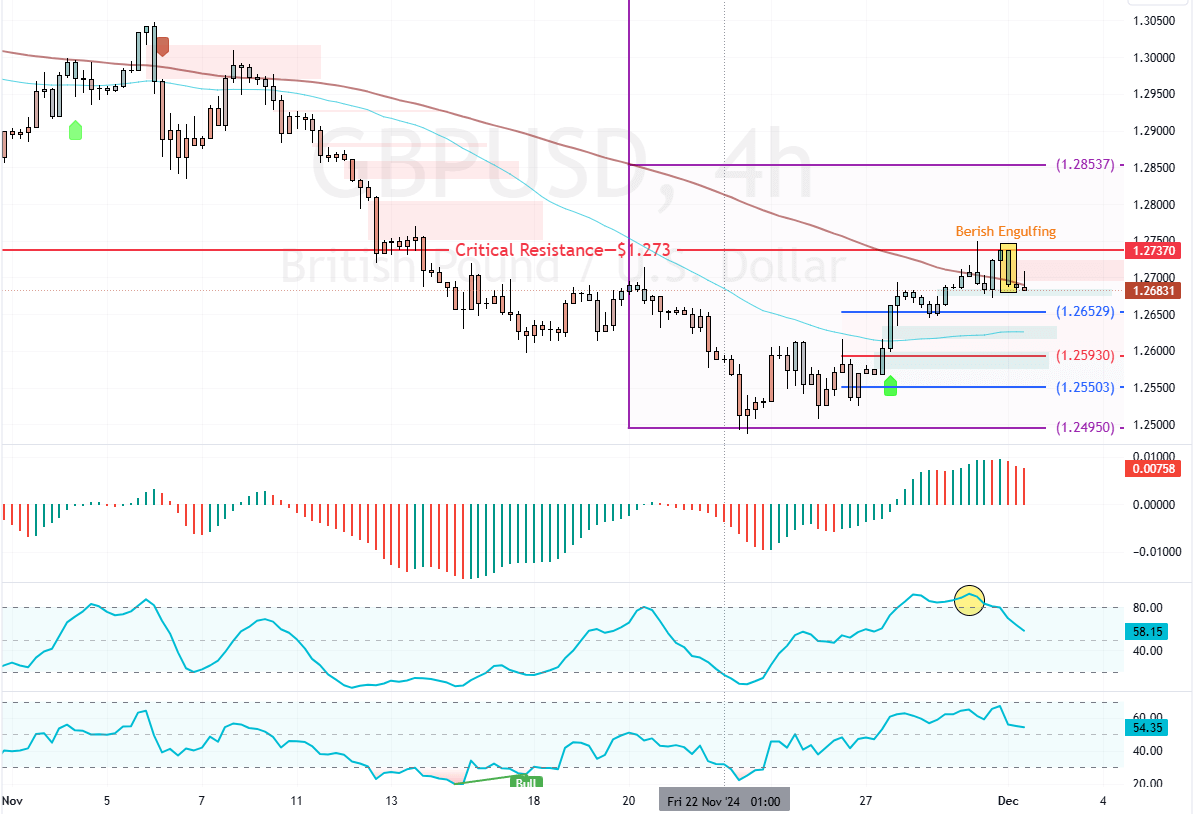
FxNews—The GBP/USD‘s uptrend from $1.249 eased after the prices peaked at the critical resistance level, the 1.273 mark. The current bearish bias in the prices was anticipated because the Stochastic hinted at an overbought market then.
As of this writing, the currency pair trades at approximately $1.269, stabilizing below the 100-period SMA.

GBPUSD Technical Analysis
The technical indicators suggest that the primary trend is bearish because GBP/USD is below the 100-SMA. Additionally, the Awesome Oscillator histogram is red, above the median line, which indicates that the bear market is strengthening.
Meanwhile, the Stochastic Oscillator stepped away from 80, hinting that the downtrend is gaining momentum. Overall, the technical indicators suggest the primary trend is bearish and should resume.
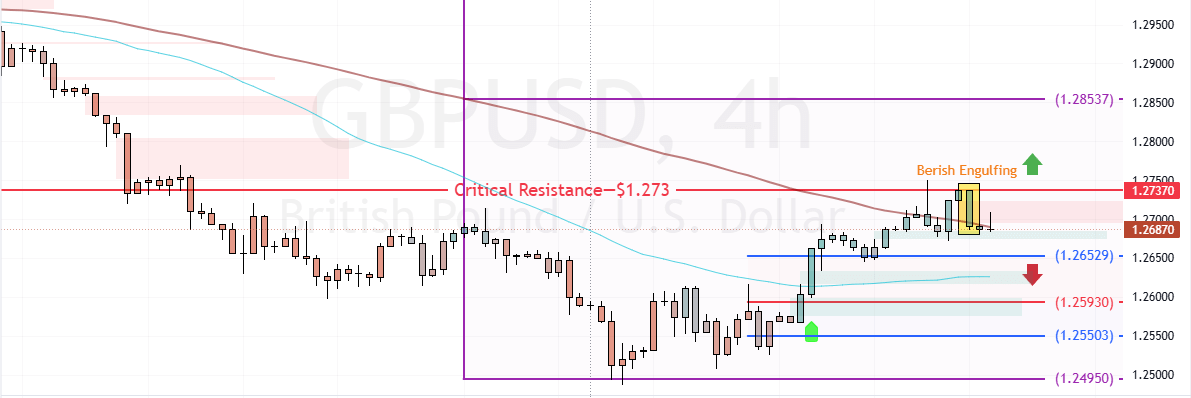
GBPUSD Bearish Engulfing at $1.273 Hints Decline

The critical resistance that divides the bull market from the bear market rests at $1.273. That said, the immediate support is $1.265. If bears push the prices below $1.265, the downtrend will likely resume. In this scenario, GBP/USD could decline toward $1.259, followed by $1.255.
On the other hand, the bearish strategy should be invalidated if GBP/USD exceeds $1.273. If this scenario unfolds, the prices could aim for $1.285.