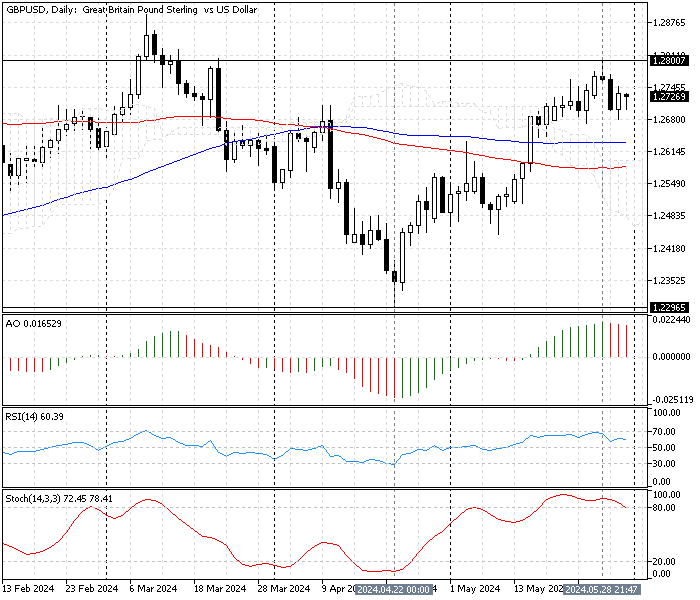
FxNews—The pound sterling has been in an uptrend against the U.S. Dollar since April 22, when it reached $1.229. The bullish trend eased after the GBP/USD pair hit the $1.28 high. This development in the pound sterling price resulted in the stochastic oscillator in the daily chart stepping into overbought territory, indicating that the trend might reverse or enter a consolidation phase.

As the daily chart above shows, the overbought stochastic caused the chart to form a Longwick candlestick pattern, and consequently, the price dipped to $1.268.
We zoom into the GBP/USD 4-hour chart for a detailed analysis and find key levels and trading opportunities.
GBPUSD Technical Analysis – 31-May-2024

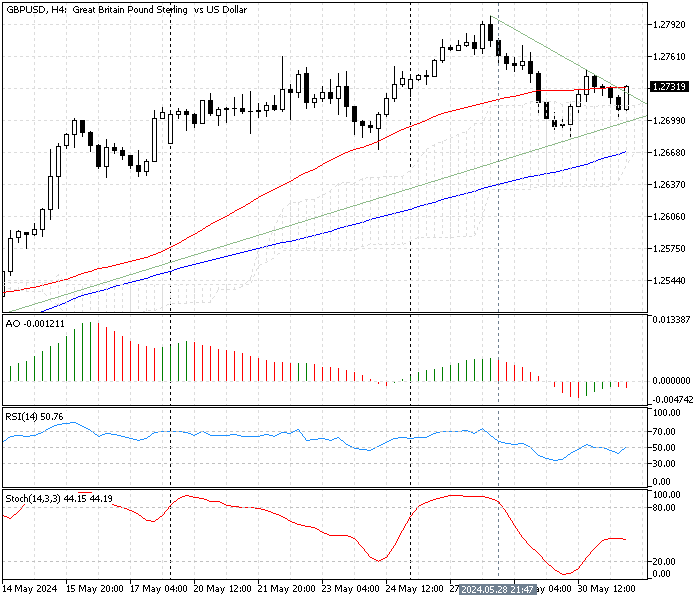
The 4-hour chart above shows the pair trades inside the apex of the bullish symmetrical triangle, testing the descending trendline at about $1.273. The GBP/USD price is also above the Ichimoku cloud, and a simple moving average of 100, signifying the uptrend prevails.
The technical indicators suggest the bullish trend should resume.
- The RSI indicator value is 50, trying to cross above the median line. This indicates the market is neutral but has a mild uptrend tendency.
- The Stochastic oscillator value is 44 and increasing. This growth in the stochastic suggests the market is not overbought, and the bullish trend could resume.
- The awesome oscillator bars are small, nearing the zero line, and their color is red. This suggests the market doesn’t have significant momentum but mild bearish proclivities. The awesome oscillator’s signal opposes the RSI and Stochastic oscillators, which give mild bullish signals. This conflict can be filtered by finding the critical support and resistance levels.
GBPUSD Price Forecast – 31-May-2024
From a technical perspective, the primary trend is bullish, so traders and investors should plan their strategies to join the prevailing market.
For the bullish trend to resume, the bulls must cross above the SMA 50 and the descending trendline at about $1.274. In this scenario, the uptick from May 30 at $1.268 will likely target the May 28 high at $1.28. If the buying pressure exceeds the May 28 high, the bulls’ path to the March all-time high at $1.2893 could be paved.
Note: Immediate support is at $1.268. If the GBP/USD price dips below this support, the bullish outlook will be invalidated.
Bearish Scenario
The immediate resistance is at $1.268, which is neighboring SMA 100. If the bears push the GBP/USD price below $1.268, the decline started on May 28 and can extend to May 3’s high at $1.468. If this scenario unfolds, the descending trendline and SMA50 will play the resistance role.
GBP/USD Key Support and Resistance Levels
Traders and investors should closely monitor the key levels below to make informed decisions and adjust their strategies accordingly as market conditions shift.
- Support: $1.268 / $1.263
- Resistance: $1.274 / $1.280
Disclaimer: This technical analysis is for informational purposes only. Past performance is not necessarily indicative of future results. Foreign exchange trading carries significant risks and may not be suitable for all investors. Always conduct your research before making any investment decisions.