In today’s comprehensive gold stock forecast, we will first scrutinize the current news about XAU/USD. Then, we will meticulously delve into the details of the technical analysis of the XAUUSD pair.
A Steady Investment Amid Global Turbulence
Reuters – On Tuesday, the price of gold fell slightly to around $1,965 per ounce. This comes after a recent increase that saw the price reach a five-month high. The stronger dollar and higher yields have contributed to this pause in gold’s ascent. Investors are now waiting for US GDP and inflation data release this week, which will provide insights into the Federal Reserve’s potential policy direction.
In the meantime, the latest PMI report indicates that the US private sector expanded unexpectedly in October. This suggests the strong US economy, supporting the argument for keeping interest rates high. However, the situation in Europe is less positive. The eurozone Composite PMI dropped to a near three-year low in October, and Germany’s business activity has been shrinking for four consecutive months.
Despite these economic fluctuations, gold continues to be seen as a safe investment. This is particularly true given the current geopolitical tensions in the Middle East. The ongoing conflict between Israel and Hamas has raised concerns about a potential escalation into a broader regional conflict. As Israel continues its attacks on Gaza, investors are increasingly turning to gold as a secure asset.
In conclusion, while gold’s price has dipped slightly, it remains a reliable investment in uncertain times. The upcoming US economic data will likely influence its future trajectory, but it continues to hold steady amidst global economic and geopolitical turbulence.
Gold Stock Forecast – XAU Tests $1949 Support
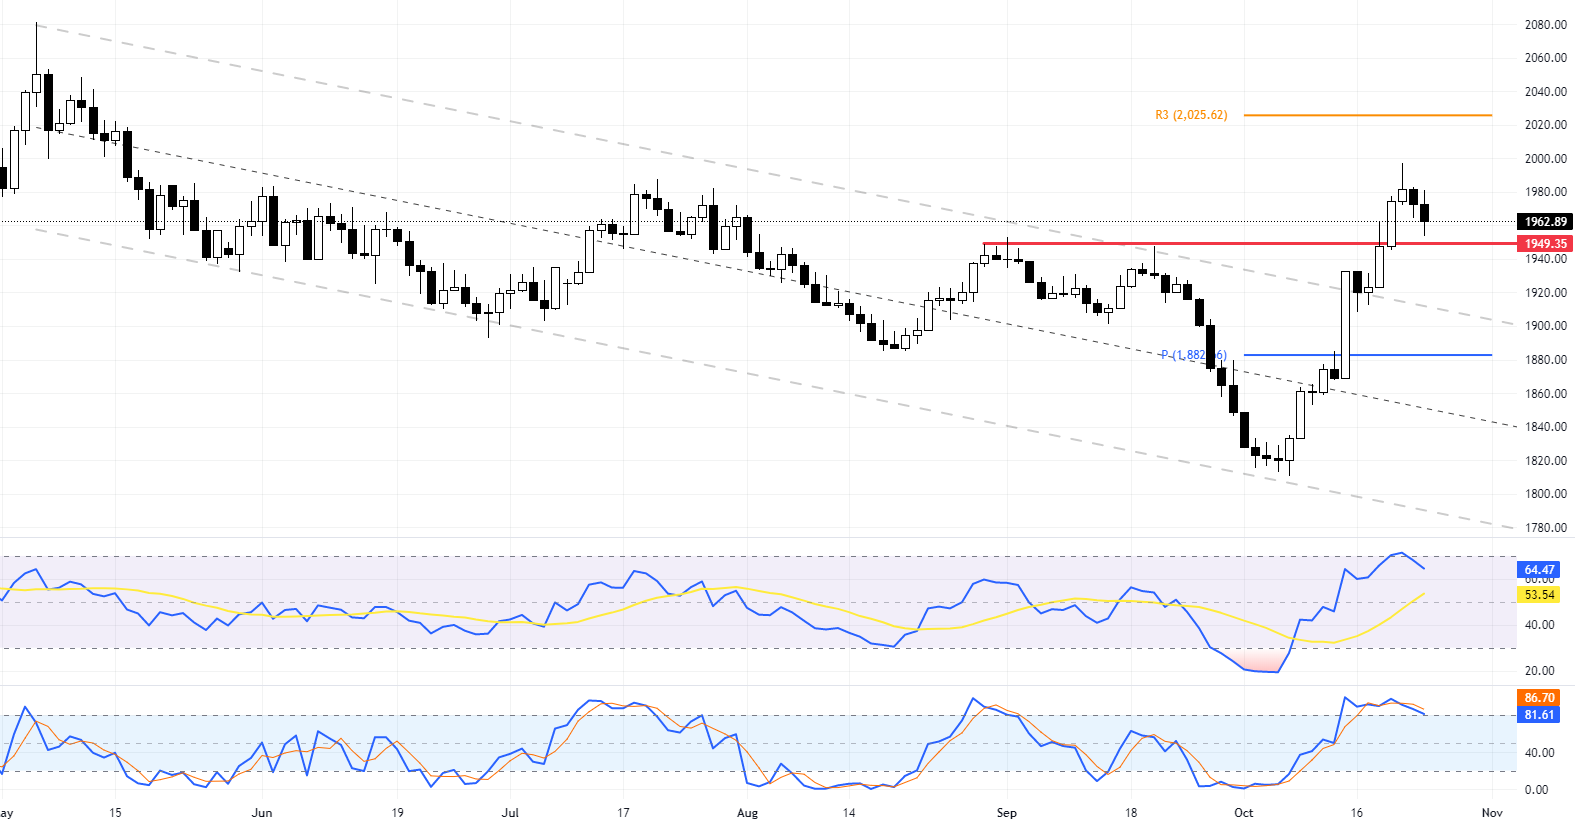
The price of gold has retreated from the $2,000 mark and is currently testing the $1,949 support level. This decline was anticipated as the RSI and Stochastic indicators were in the overbought zone.

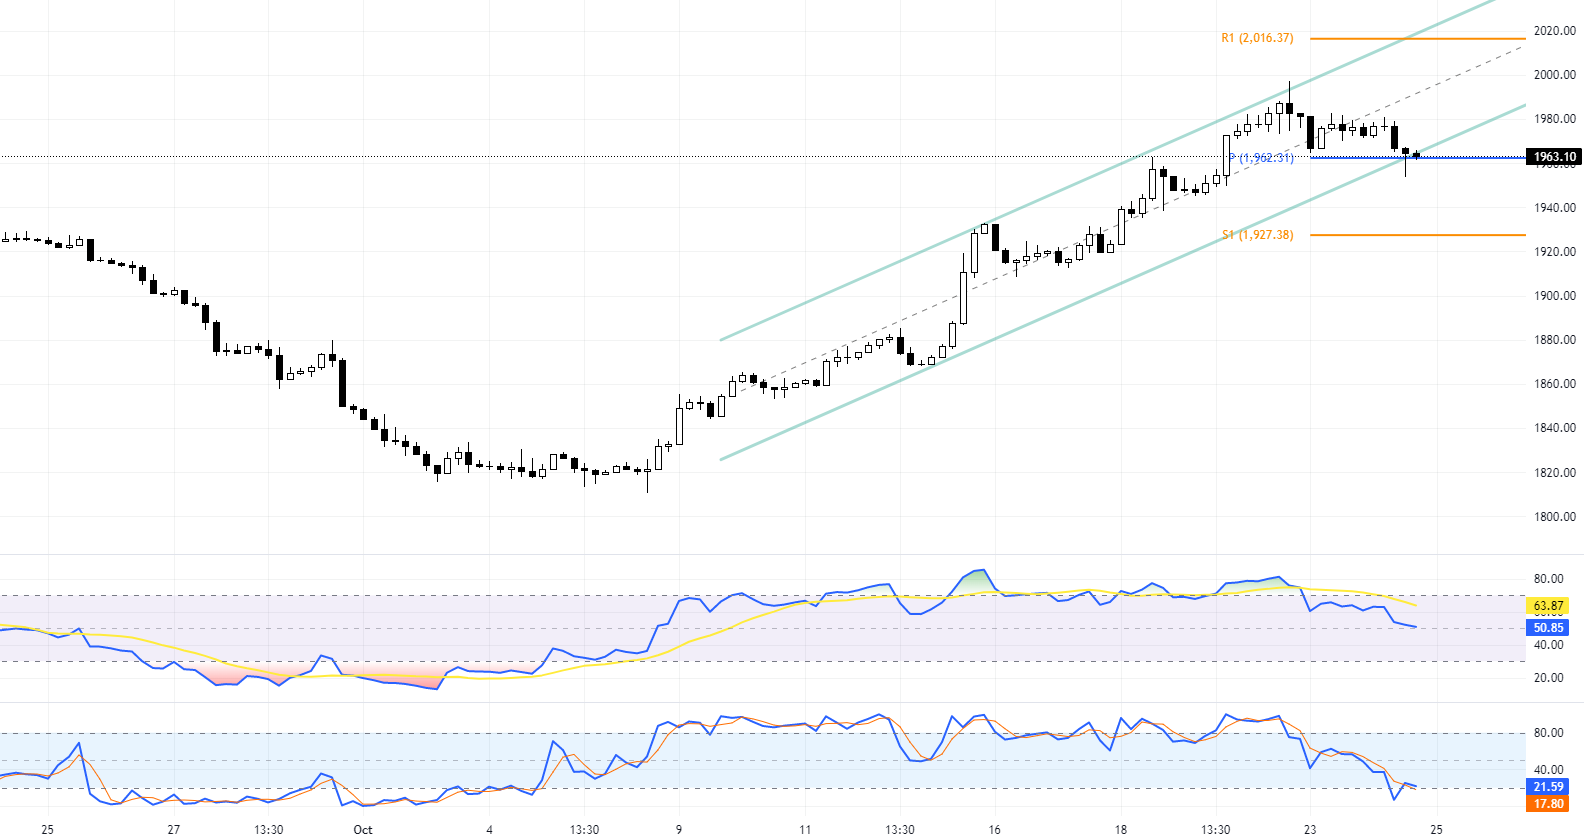
A closer look at the 4-hour chart provides a clearer picture of gold’s price action. The precious metal formed a hammer candlestick pattern at the pivot point ($1,962), and the stochastic oscillator is nearing the overbought zone, indicating a potential exit from this area. The RSI indicator remains above 50.

Gold Forecast
Considering current market data, technical indicators, and key levels, if the price can remain above $1,949, the XAUUSD price will likely rise to R3 ($2,025).
Conversely, if bears push the price below $1,949, we could see a continued decline toward the upper line of the bearish channel around $1,900.