The Head and Shoulders candlestick pattern is like a roadmap for traders trying to guess where currency prices might go next. As its name suggests, this pattern looks a bit like the top part of a person and can give important hints about the market. This article will break down this pattern in easy-to-understand terms and show you how to use it in trading.
Understanding the “Head and Shoulders Candlestick Pattern
Imagine a person’s head and shoulders. Now, picture that in a graph. The “Head and Shoulders” (H&S) pattern is a bit like that – and it’s a way to guess where currency prices might go next. Let’s break it down, simplify it, and see how it works with real examples.
What Does the Pattern Look Like?
This pattern has three main parts:
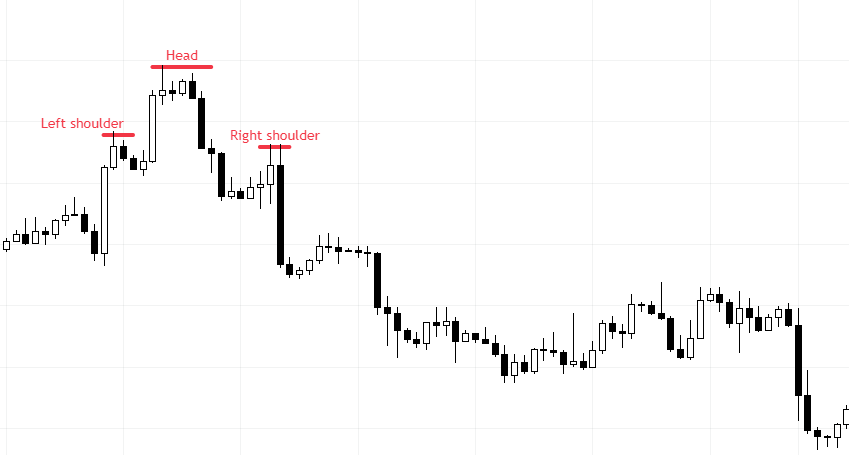
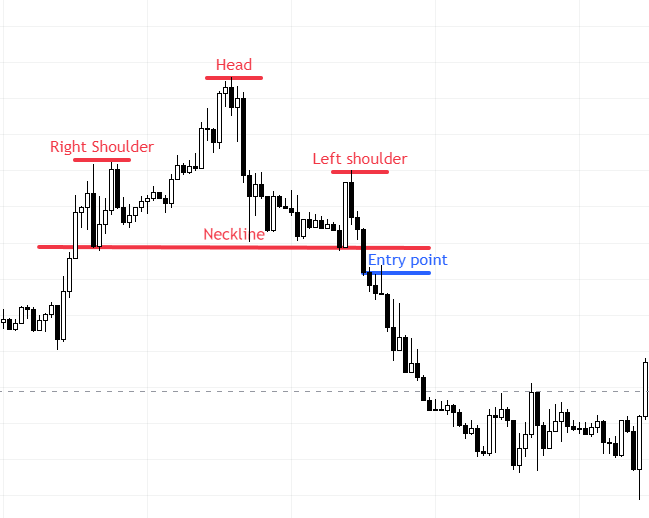
- Left Shoulder: They might drop a bit after prices have increased for a while. This small peak is the left Shoulder.
- Head: Prices go up again but higher this time, then drop. This highest peak is the head.
- Right Shoulder: Prices rise slightly but not as high as the head, then fall again, forming the right Shoulder.
- Neckline: Draw a line connecting the lowest points after the left shoulder and head. This is your neckline.
Imagine it as a mountain range with a tall peak (the head) between two smaller ones (the shoulders).

There’s also an upside-down version called Reverse Head and Shoulders, showing prices might increase.
How Do We Use Head and Shoulders Candlestick Pattern?
Using our H&S pattern, here’s a simple way to make trading decisions:

- Wait for a Sign: Before anything, wait until prices drop below the neckline after the proper shoulder forms. Only then can we be pretty sure about the pattern.
- When to Sell: If prices drop below the neckline, it might be a good time to sell.
- Play it Safe: If you’re wrong and prices go up, set a point (above the right Shoulder) to stop and prevent significant losses.
- Setting a Goal: See the height of the head above the neckline. Expect prices to drop about that much below the neckline.
Examples of Head and Shoulders Patterns
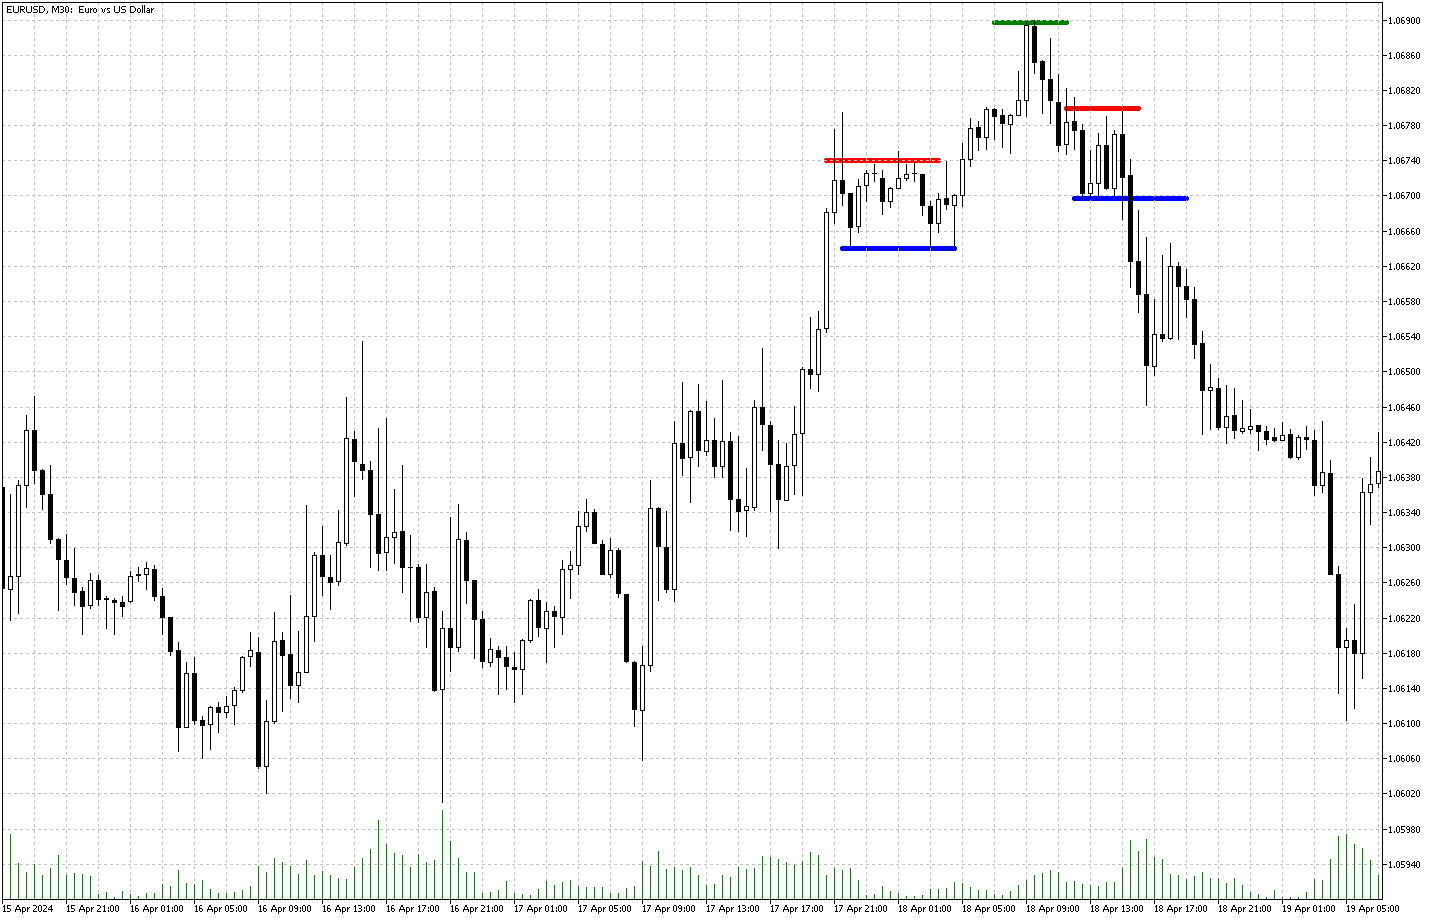
Let’s say the Euro (EUR) and US Dollar (USD) currency pair (EUR/USD) shows this pattern:

- Left Shoulder ranges between 1.0663 and 1.0673
- The head goes high to 1.0689
- Right Shoulder ranges between 1.0669 and 1.068
- The neckline is around 1.0673.
As depicted in the EUR/USD 30-minute chart above, the U.S. Dollar first struggled with the right shoulder bottom at 1.0669 against the European currency. However, as selling pressure increased, the bears broke down the 1.0669 resistance, and as a result, the pair started to decline.
Things to Remember
The H&S pattern is helpful, but it’s not perfect. Keep these in mind:
- False Alarms: Sometimes, prices might trick us by dipping below the neckline and then shooting up.
- Other Factors: Look at other high and low points on the graph. They can change how the pattern works.
- Volume: How much is traded in other markets can help confirm the pattern. But in forex, this info isn’t always reliable.
Final Thoughts
The Head and Shoulders candlestick pattern is like a tip from the market, hinting at where prices might head next. By watching for this pattern and using it wisely, traders can make better guesses and, hopefully, better profits!