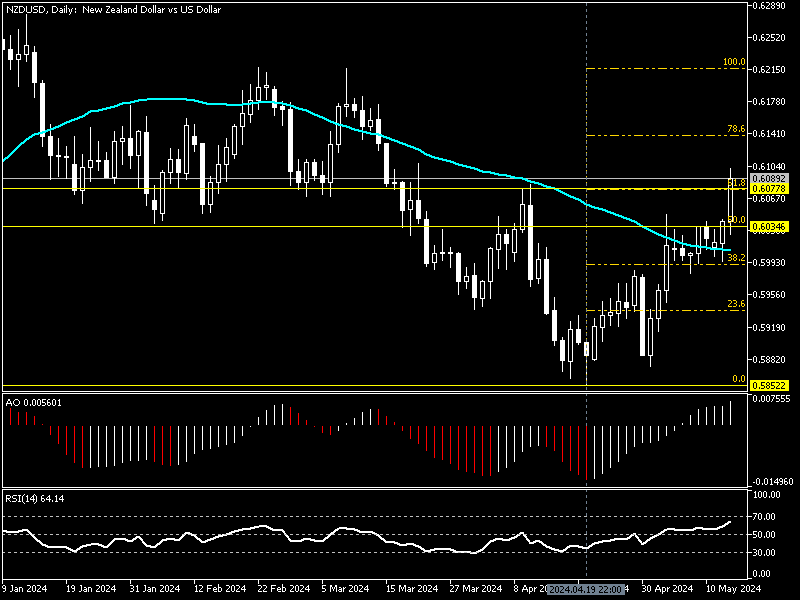
FxNews—The New Zealand Dollar has been in an uptrend against the U.S. Dollar since April 4, when the exchange rate dropped to as low as $0.5852.
The uptrend eased after the price reached the 50% Fibonacci support, the 0.603 mark. But, in today’s trading session, the bulls made a breakthrough, and as of writing, the NZDUSD pair trades at about 0.608, slightly above 61.8% Fibonacci.

NZDUSD Technical Analysis – The 4-Hour Chart
To conduct a detailed analysis and find key levels and trading opportunities, we zoom into the NZD/USD 4-hour chart.
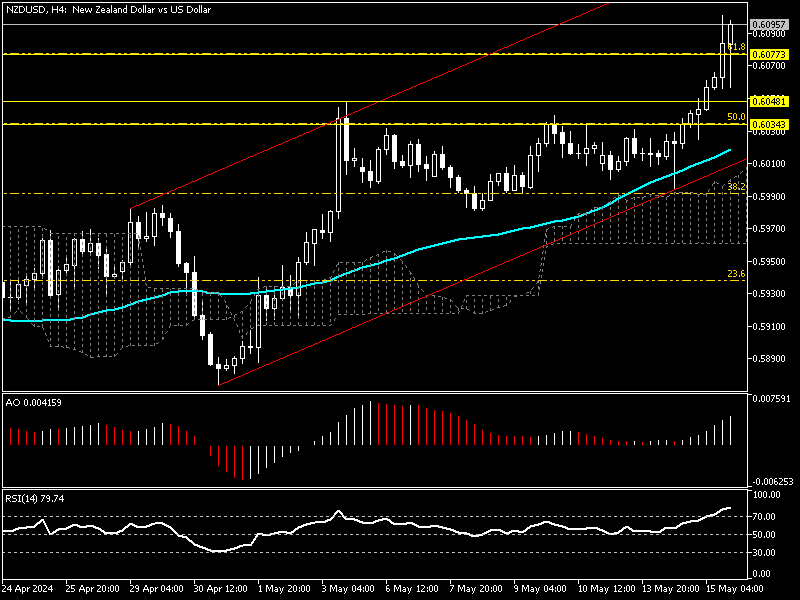
The 4-hour chart below demonstrates the currency pair’s robust uptrend. The New Zealand dollar is stabilizing the price above 61.8% Fibonacci, the $0.607 mark. The extreme buying pressure on the pair drove the relative strength index into the overbought zone, hovering around 78.0 when writing.
This development in RSI warns us that the market is saturated from the buying pressure, and the momentum might slow down anytime soon.

In addition to RSI, the awesome oscillator bars signal divergence, indicating that the bullish trend might slow down or the trend might step into a consolidation phase. This signal aligns with the RSI; now, we have two indicators promising the market might cool down.
In conclusion, the technical tools warn traders and investors about the overbought market and an imminent slowdown or a consolidation phase. Therefore, analysts at FxNews do not suggest going long on the NZD/USD pair in this situation.
How to Profit from the Bullish Trend in NZDUSD

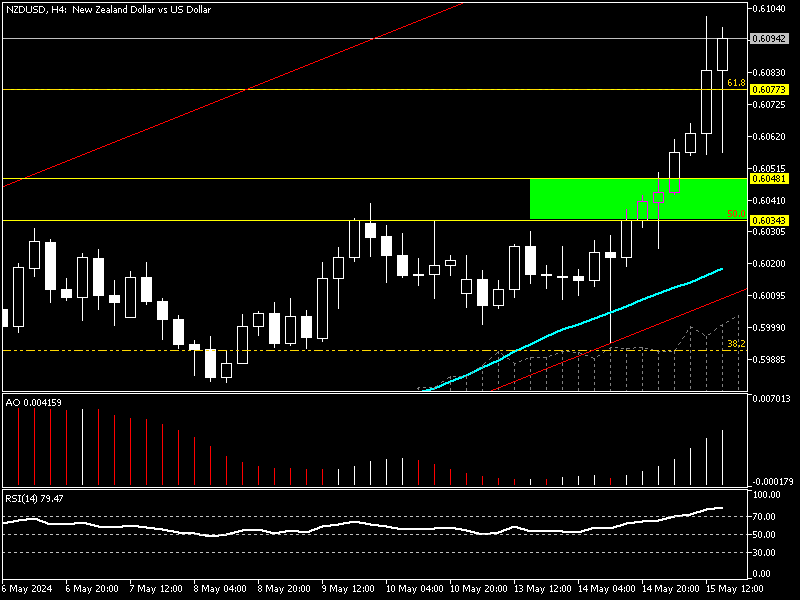
The primary trend is bullish, so it is wise to join it instead of trading against it. That said, waiting for the U.S. Dollar to erase some of its recent losses against New Zealand’s currency is wise. With this approach, if the price declines to $0.604 or $0.603, the market delivers a decent bid for traders and investors to join bulls with a much smaller risk.
The $0.604 and $0.603 support levels have 50% Fibonacci support and EMA 50 as backup. Thus, monitoring these decks for bullish candlestick patterns is highly suggested. There is a high chance for the market to return to the upside from EMA 50 and the aforementioned support area.
NZDUSD Key Support and Resistance Levels
Traders and investors should closely monitor the NZD/USD key levels below to make informed decisions and adjust their strategies accordingly in market shifts.
- Support: $0.604, $0.603, $0.599
- Resistance: $0.613