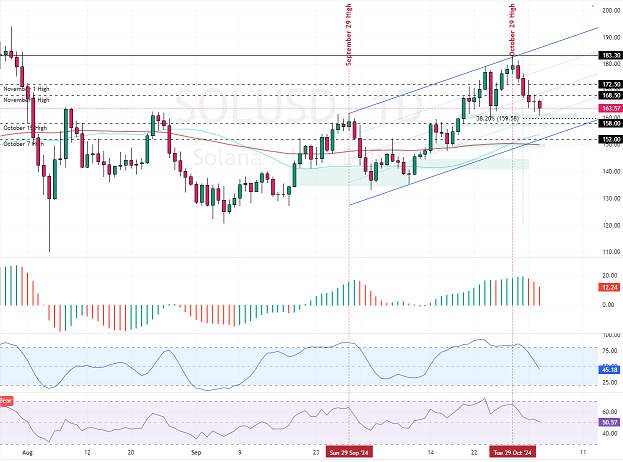
FxNews—Solana‘s value declined from the October 29 high of $183.0. The bearish momentum eased when the price neared the 38.2% Fibonacci retracement level at $159.5. As of this writing, the SOL/USD pair trades at approximately 163.7, pulling away from the 159.5 support backed by the bullish Fair Value Gap.
The Solana daily chart below demonstrates the price, support, resistance levels, and technical indicators utilized in today’s analysis.

Solana Technical Analysis – 3-October-2024
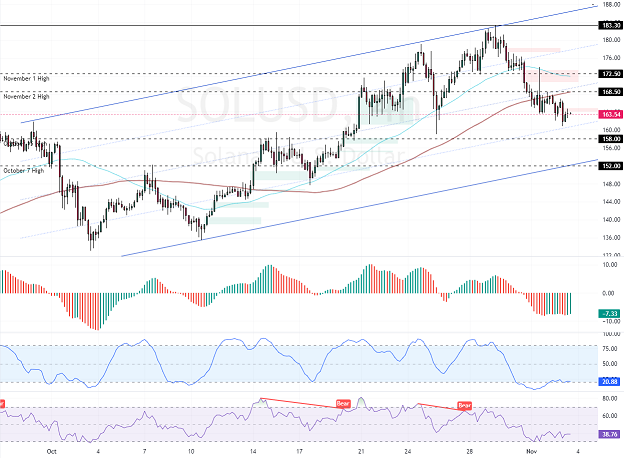
Zooming into the 4-hour chart, we notice Solana’s price is below the 100-period simple moving average, meaning the primary trend is bearish. On the other hand, the Stochastic Oscillator shifted above the 20 level, and the Awesome Oscillator histogram changed color to green, depicting -7.65 in the description.

These developments in the technical indicators suggest the primary trend is bearish, but Solana’s bulls have the potential to raise the price or impose a consolidation phase on the market.
Solana Forecast – 3-October-2024

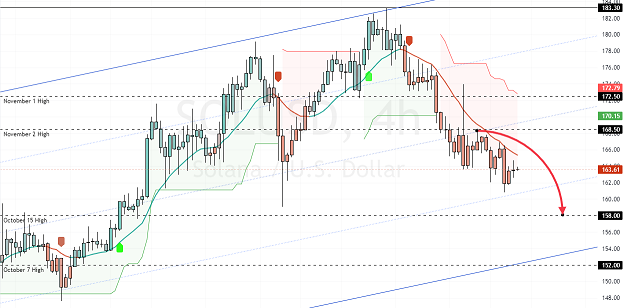
From a technical perspective, the trend outlook remains bearish as long as Solana trades below the immediate resistance of $168.5 (November 2 High). In this scenario, the downtrend will likely resume with the next bearish target at $158.0 (October 15 High).
Furthermore, if the selling pressure exceeds $158.0, the next bearish target could be the October 7 high at $152.0. Please note that the bearish strategy should be invalidated if SOL/USD exceeds $168.5.
Solana Bullish Scenario

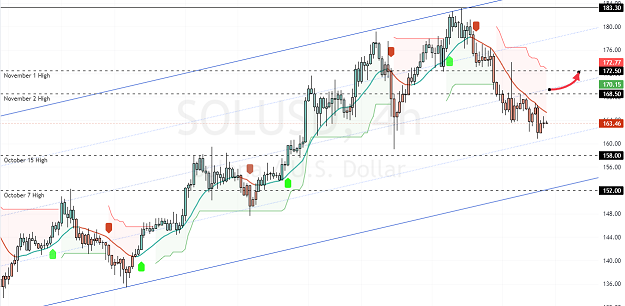
If bulls (buyers) close above the immediate $168.5 resistance, a new bullish wave may emerge, allowing Solana to revisit the November 1 high of $172.5.
Furthermore, if buying pressure exceeds $172.5, the next bullish target will likely be the October all-time high at $183.3.
Please note that the 100-period simple moving average will primarily support the bullish strategy.
Solana Support and Resistance Levels – 3-November-2024
Traders and investors should closely monitor the key levels below to make informed decisions and adjust their strategies accordingly as market conditions shift.
- Support: 158.0 / 152.0
- Resistance: 168.5 / 172.5 / 183.3