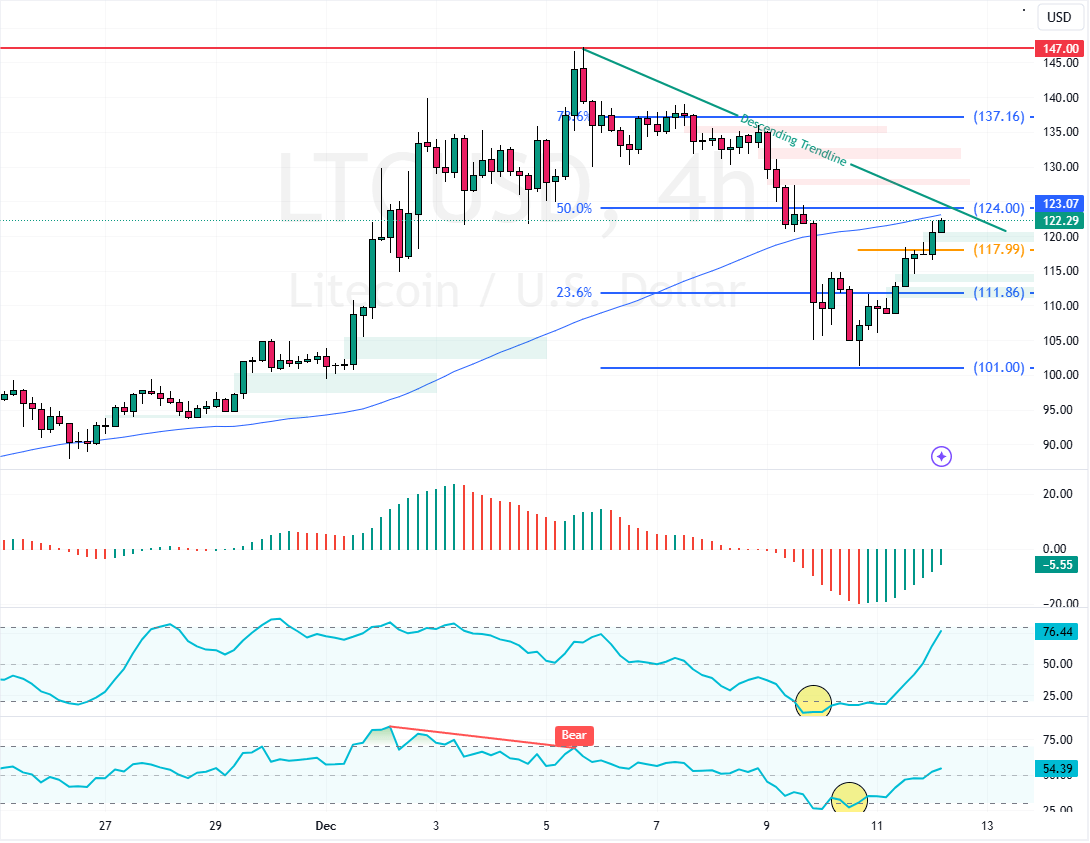
FxNews—Litecoin rose from $101.0 on RSI 14 and Stochastic’s oversold signals. LTC/USD trades at approximately $122.0, testing the 50.0% Fibonacci resistance level, backed by the 75-period simple moving average.

Litecoin Technical Analysis – 12-December-2024
As for the technical indicators, the Awesome Oscillator histogram is green and above the signal line, indicating that the bullish trend should prevail. Furthermore, the RSI and Stochastic show 53 and 76 in the description, meaning Litecoin is not overbought; therefore, the uptrend should resume.
Overall, the technical indicators suggest the primary trend is bullish and should resume.
Key Points for Next Bullish Move
The immediate resistance is at $124.0. From a technical perspective, Litecoin’s uptrend will likely extend to higher bullish barriers if buyers close and stabilize the prices above the immediate resistance. The next bullish target in this scenario could be the 78.6% Fibonacci retracement level at $137.0.
Please note that the bullish outlook for LTC/USD should be invalidated if the crypto‘s value falls below $118.0, the immediate support. If this scenario unfolds, LTC/USD could resume its bearish trajectory, targeting $111.0.