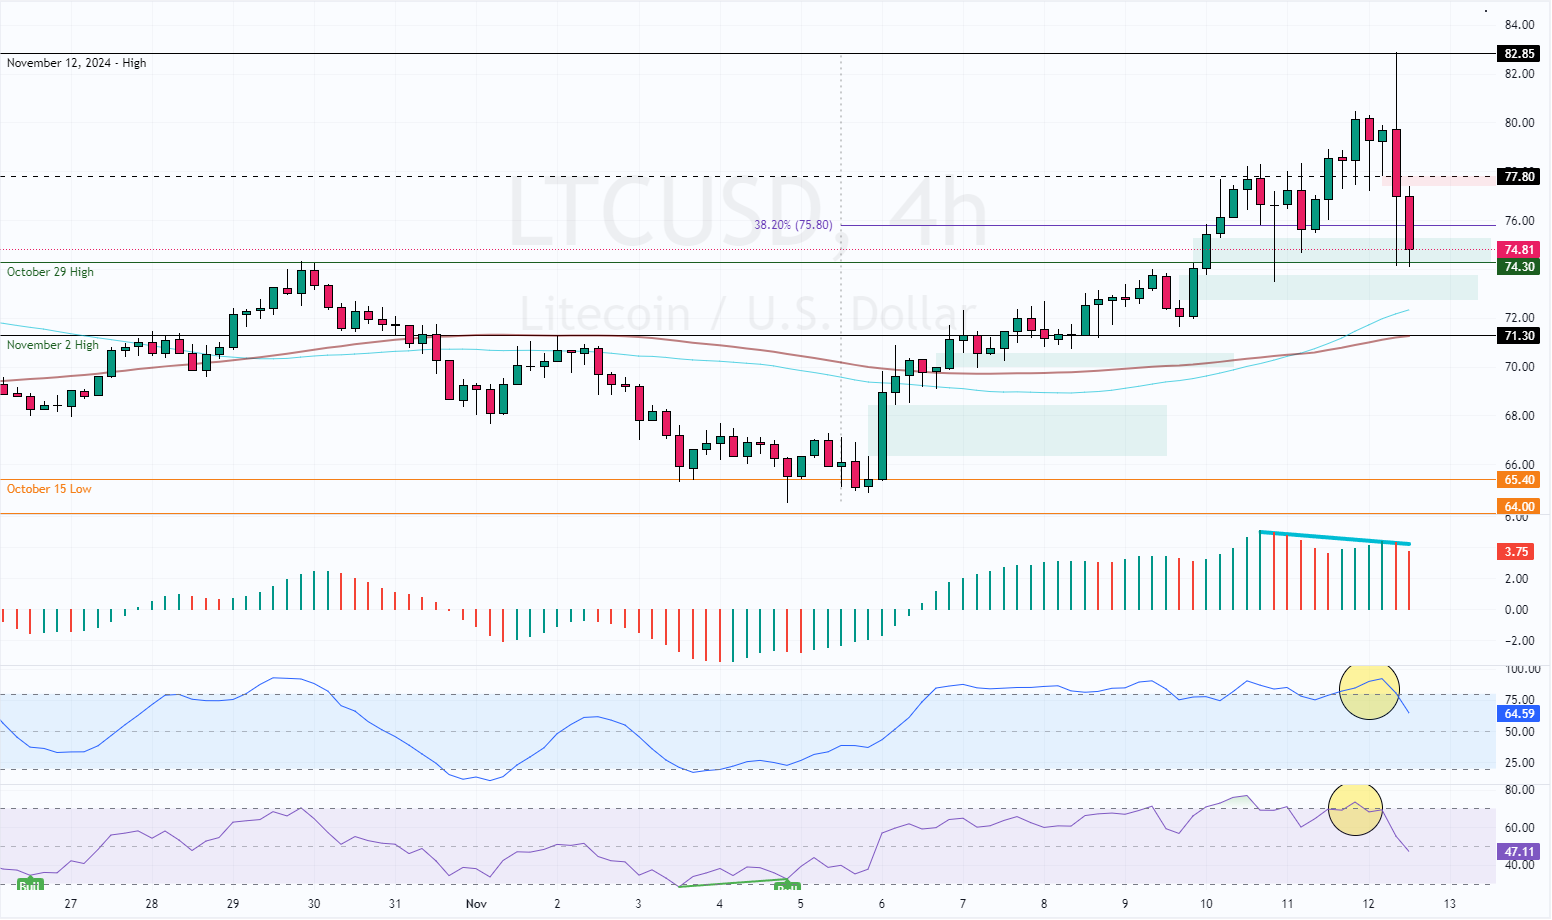
FxNews—Litecoin price declined from $82.85 in today’s trading session. As of this writing, the LTC/USD crypto pair trades at approximately $74.5, filling the bullish Fair Value gap.
The 4-hour chart below demonstrates the price, support, and resistance levels, as well as the technical indicators utilized in today’s analysis.

Litecoin Technical Analysis
Today’s bearish wave was anticipated because the Stochastic and RSI 14 hovered overbought territory. Additionally, the Awesome Oscillator signaled divergence, meaning a consolidation phase or a trend reveal pattern.
That said, the Litecoin price is still above the 50-period simple moving average, hinting at a bullish primary trend.
Litecoin Price Forecast
The October 29 high at $74.3 is the critical support that divides the bull market from the bear market. Therefore, the market outlook should remain bullish as long as the LTC price exceeds that support.
Furthermore, the immediate resistance rests at the 38.2% Fibonacci retracement level, the 75.8 mark. From a technical perspective, the uptrend will likely resume if the Bulls close and stabilize Litecoin above the immediate resistance. In this scenario, LTC/USD could retest the 82.85 resistance again.
Bearish Scenario
Conversely, the bullish strategy should be invalidated if bears push the Litecoin price below the $74.3 support. If this scenario unfolds, the downtrend could extend to $71.4 (November 2 High).
- Support: 74.3 / 71.3
- Resistance: 77.8 / 82.85