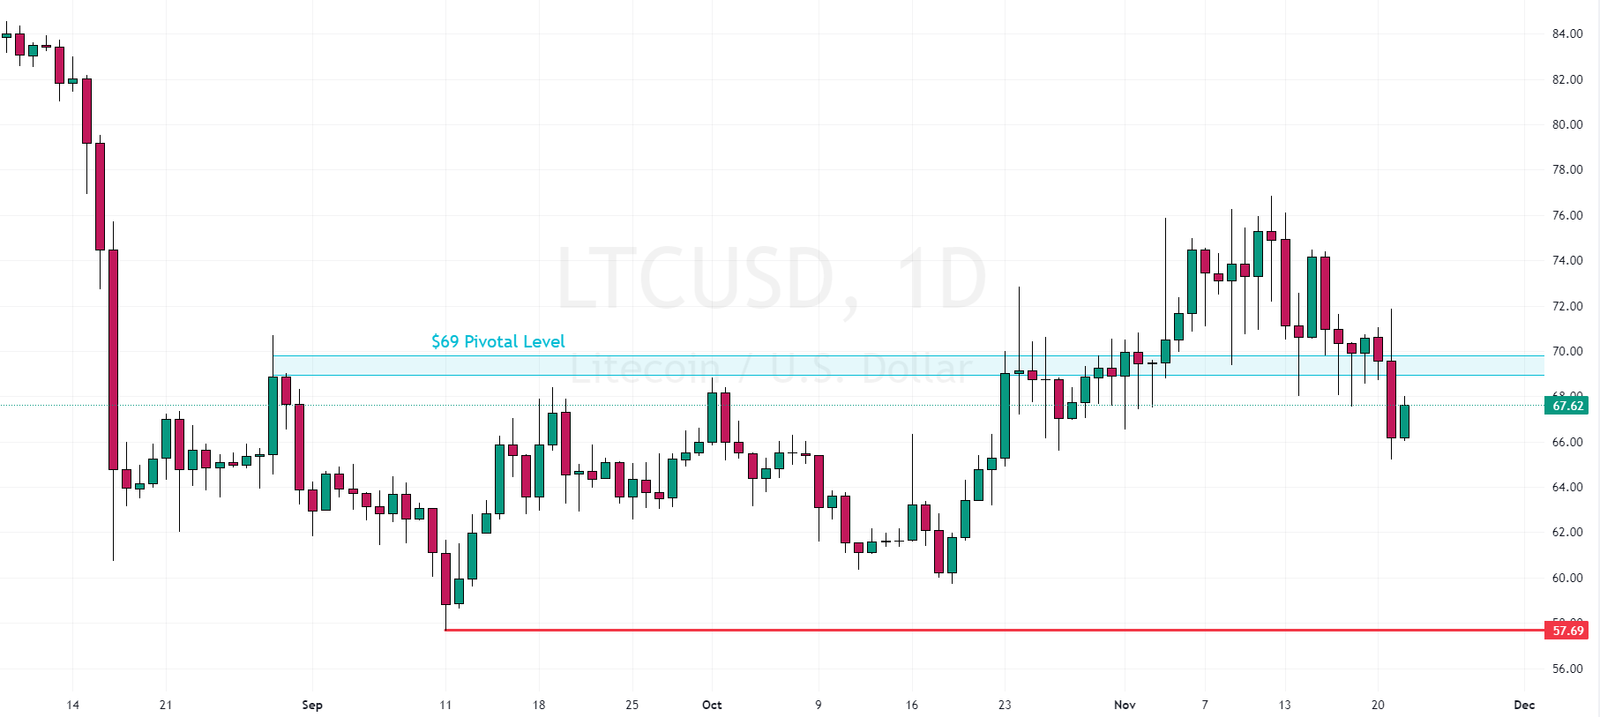
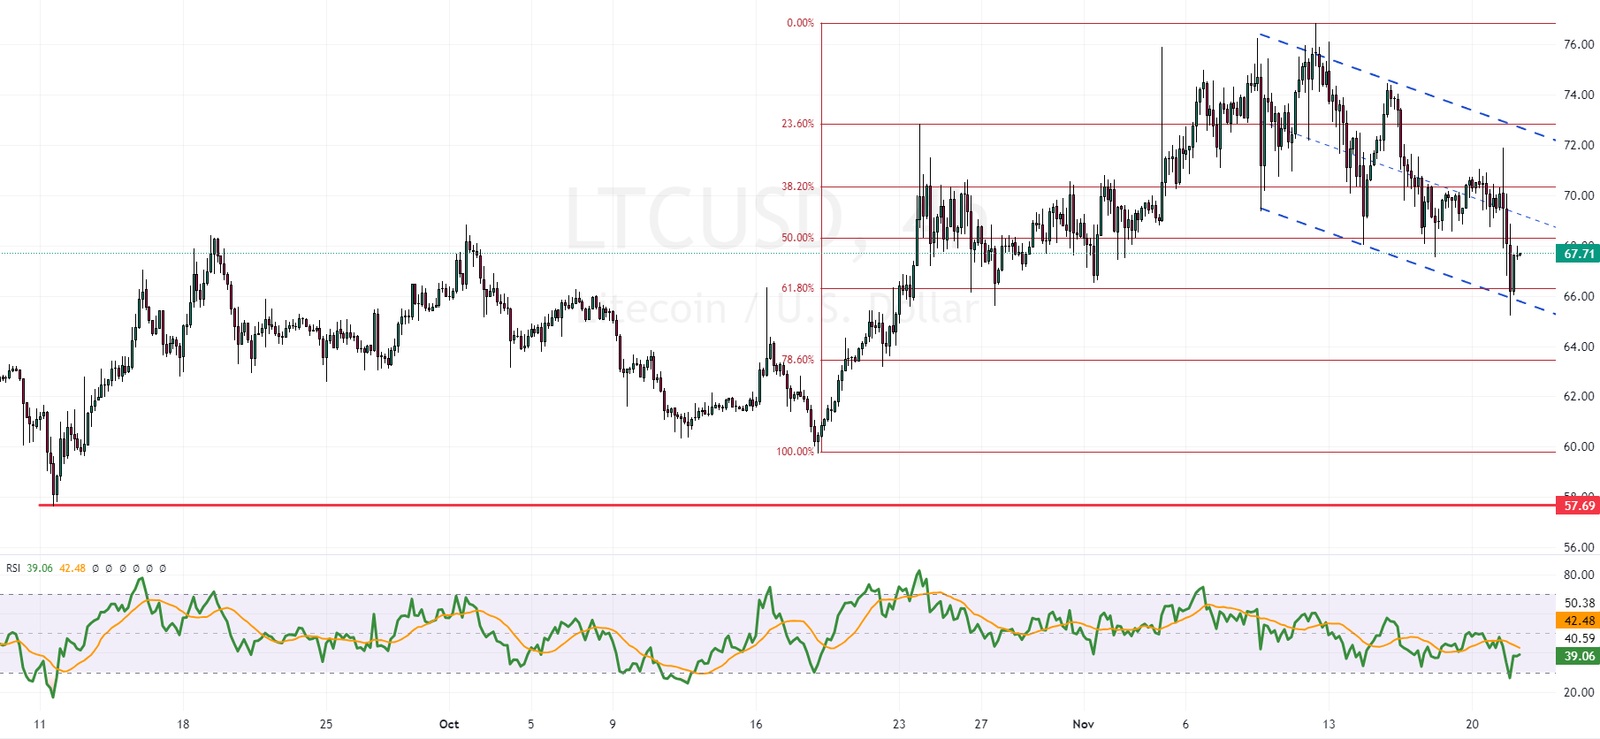
FxNews—In today’s Litecoin technical analysis, we scrutinize the Litecoin chart across both daily and 4-hour timeframes. Analyzing higher timeframes provides better insight into the price action and LTCUSD forecast.
Litecoin Technical Analysis – Bullish Hopes Plunge

While other major crypto assets like Bitcoin and Ethereum have experienced significant bullish momentum recently, Litecoin has not followed the current cryptocurrency market trend, falling behind. Yesterday, the LTCUSD pair broke below the pivotal $69 level, a significant resistance now breached. This breach also diminishes the silver linings for the bulls.

Diving into the 4-hour chart, we examine the next target for bears currently in control. Litecoin is trading within a bearish channel and tested the 61.8% Fibonacci retracement level in today’s session.
Concurrently, the RSI indicator plunged into the oversold area, giving the bulls confidence to push the price up. The Litecoin bulls might aim for the bullish flag’s median line or upper line. Given the bearish market, both resistance levels could provide decent bid prices for bears to refresh their short positions.
Considering the current market conditions, the ultimate bearish target appears to be the $57 – $60 area unless LTCUSD surpasses the $69 mark and stabilizes.
I hope this Litecoin technical analysis aids your cryptocurrency trading decisions. Please remember that trading forex involves high risk, and you might lose more than expected. Trade with minimal risk and only invest what you can lose without significant distress.