The New Zealand dollar closed the week at 0.611 against the U.S. dollar. The pair trades above EMA 50 and the ascending trendline, suggesting that the primary trend of the NZD/USD currency pair is bullish.
NZD/USD Technical Analysis 4-Hour Chart

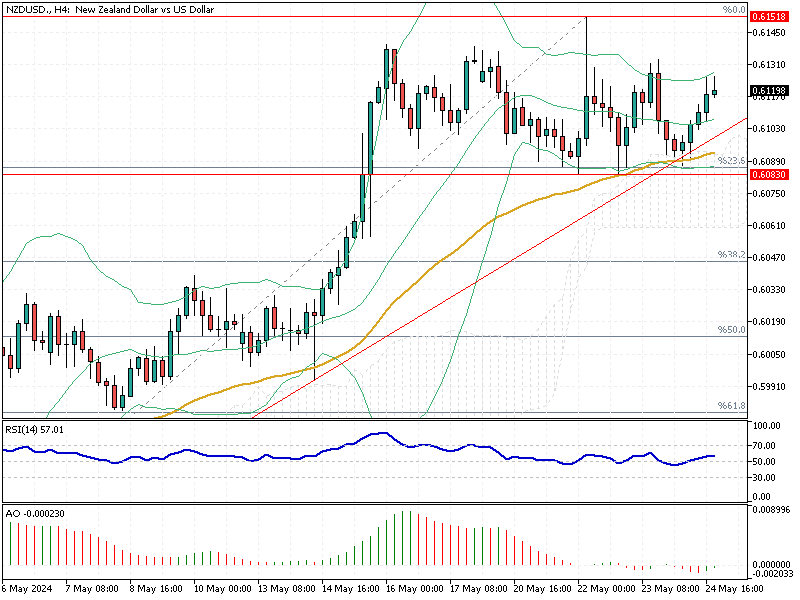
The price has been following an ascending trendline, as shown in the 4-hour chart above, which suggests a bullish bias in the short term. The NZD/USD pair has tested this trendline three times, indicating a significant support level.
Fibonacci Levels
The Fibonacci retracement levels are drawn from the recent low of 0.587 to the highest peak in May 2024, 0.615, which shows key support and resistance levels.
Immediate resistance is noted around the 23.6% Fibonacci level at 0.66086, which aligns with EMA 50, Ichimoki Cloud, and the ascending trendline (in red).
Moving Averages

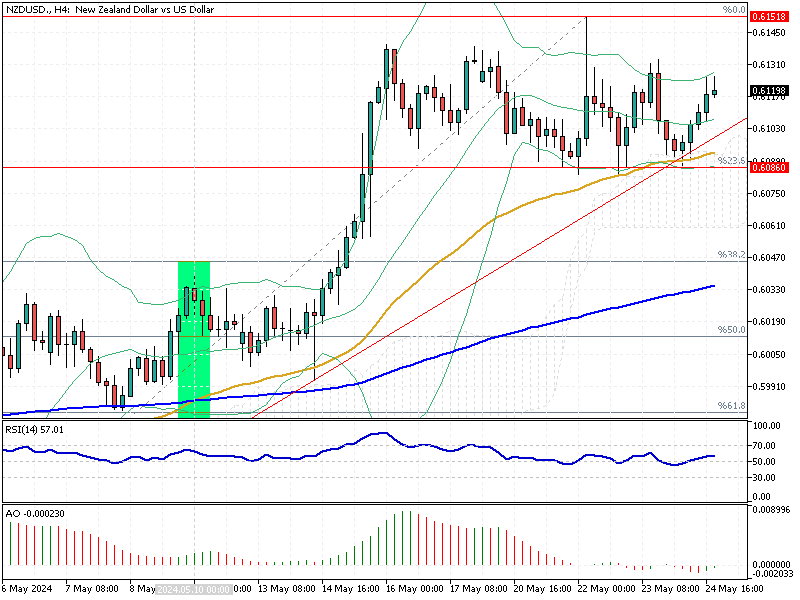
The price trades above the 50-period exponential moving averages, reinforcing the short-term bullish sentiment. The crossover of the 50-period moving average above the 200-period moving average (in blue) on May 10 (Golden Cross) is a bullish signal. As shown in the image above, the bullish momentum escalated and peaked at 0.615 after the Golden Cross.
Bollinger Bands
The price is near the upper Bollinger Band, indicating potential overbought conditions. Bollinger Bands are widening, suggesting increasing volatility. This development in the Bollinger band suggests the NZD/USD pair might have a pullback from the current exchange rate at 0.611 to the 23.6% Fibonacci level at 0.608.
RSI (14)
The RSI is at 57.0, in the neutral to slightly bullish zone. This indicates room for upward movement before reaching overbought conditions. Therefore, the bullish market might resume after a slight pullback from 0.611.
Awesome Oscillator
The Awesome Oscillator shows positive momentum, with green bars indicating bullish momentum above the zero line. However, the bars are small, depicting 57 in the value, meaning the bullish momentum is weak.
NZD/USD Technical Analysis 1-Hour Chart

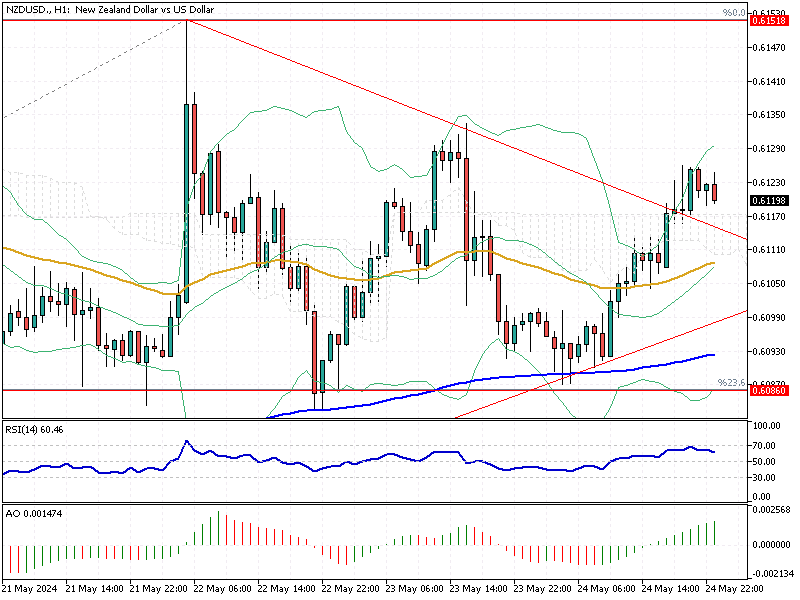
The daily chart shows the NZD/USD pair respecting an ascending trendline. On Friday, it broke out from the descending trendline, further supporting the bullish trend. The price has been making higher highs and higher lows, which is a classic indication of an uptrend.
Moving Averages
The price is consistently above the 50-day and 200-day moving averages, indicating a strong upward trend in the longer term.
Bollinger Bands
The 1-hour chart Bollinger Bands shows the price nearing the upper band, suggesting potential overbought conditions. The bands are slightly widening, indicating potential for increased volatility.
RSI (14)
The daily RSI is at 60.4, which is still below the overbought threshold of 70, suggesting there is still room for further upward movement.
Awesome Oscillator
The Awesome Oscillator is positive with a value of 60.4, with green bars indicating bullish momentum above the zero line, confirming the upward trend.
NZDUSD Bull Market Resumes Above 0.608

Based on the technical analysis of the 4-hour and daily charts, the NZD/USD currency pair shows a bullish trend in both the short-term and long-term perspectives. That said, the uptrend will likely resume if the bulls maintain a position above the 23.6% Fibonacci retracement level at 0.608 the uptrend.
In this scenario, the initial target is 0.615; if the buying pressure exceeds, the road to 0.6215 will be paved for the bulls.
NZD/USD Bearish Scenario
Conversely, the immediate support level is around 0.608, backed by the 23.6% Fibonacci retracement, EMA 50, and the ascending trendline. If this level is breached, the next significant support would be around 0.604, near the 38,2% Fibonacci retracement level, backed by 200 EMA.
Conclusion
Overall, the outlook for the NZD/USD pair is bullish as long as it stays above the key support levels and continues to respect the ascending trendline. Traders should monitor the immediate resistance at 0.615 for a breakout confirmation to target higher levels.
Disclaimer: This technical analysis is for informational purposes only. Past performance is not necessarily indicative of future results. Foreign exchange trading carries significant risks and may not be suitable for all investors. Always conduct your research before making any investment decisions.