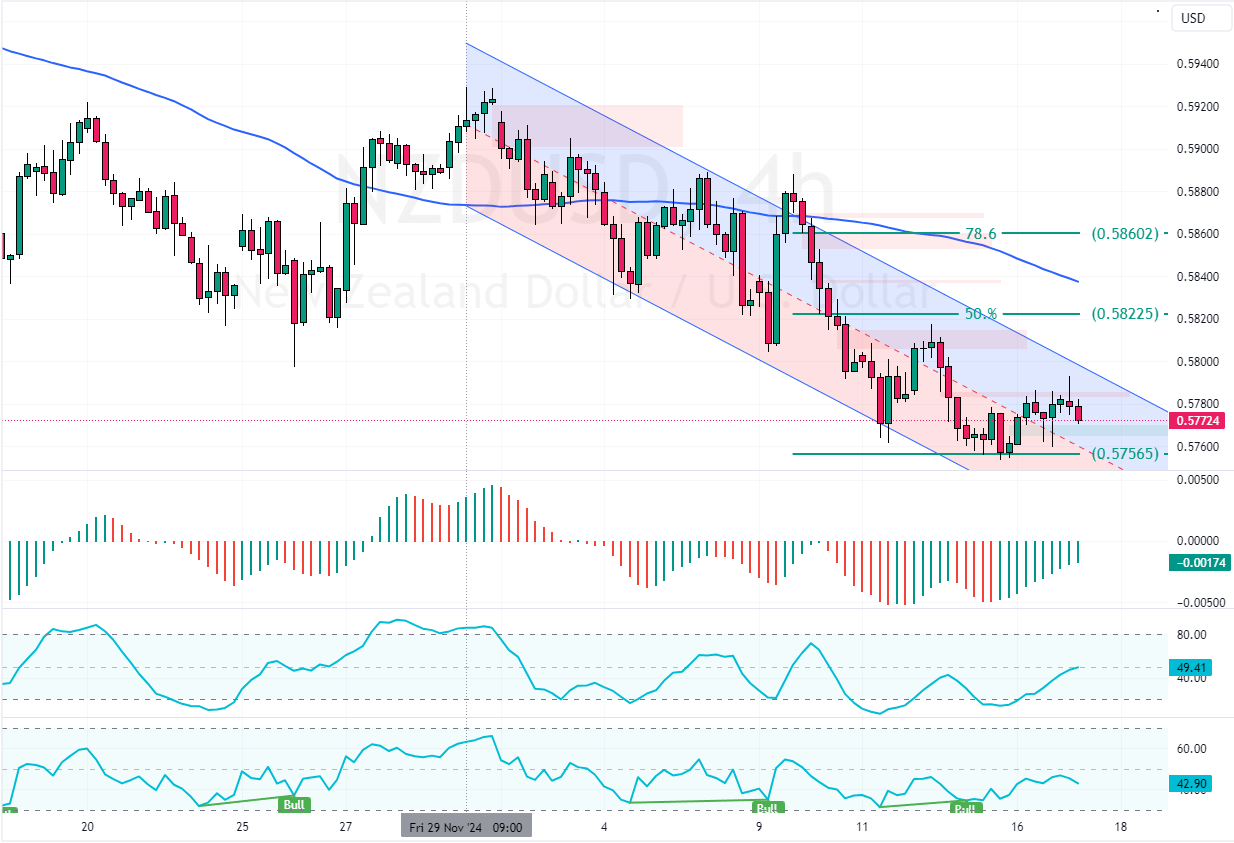
NZD/USD is in a downtrend, and it formed a long upper shadow candlestick pattern in the 4-hour chart. The immediate support is at 0.575. A break below this level could increase selling pressure, extending the drop toward 0.573.

NZDUSD Technical Analysis – 17-December-2024
The New Zealand dollar trades in a bear market against the Greenback at approximately 0.577 and is declining. The downtrend is obvious as the currency pair’s value is below the 75-period simple moving average and the descending trendline, as the 4-hour chart shows.
As for the technical indicators, we notice the Awesome Oscillator histogram is green, approaching the signal line from below. Additionally, the Stochastic rose toward the median line, depicting 49 in the description, signaling bull market strength.
However, the 4-hour chart formed a long upper shadow candlestick pattern, meaning the bears added pressure to NZD/USD.
Overall, the technical indicators give mixed signals. However, the primary trend is bearish below the 75-period SMA and should resume according to the candlestick pattern.
Watch NZDUSD for a Potential Drop to 0.573

The immediate resistance rests at the 50% Fibonacci retracement level. Please note that the NZD/USD trend outlook remains bearish as long as it trades below 0.582. On the other hand, the immediate support lies at 0.575.
From a technical perspective, the downtrend will likely extend to lower support levels if NZD/USD falls below 0.575. In this scenario, the next bearish target could be 0.573, followed by 0.568.