FxNews—On Monday, the primary stock index of New Zealand, the S&P/NZX 50, fell by 0.6%, ending the day at 12,767 points. This decline followed a period of high performance, marking a setback from a nearly three-year peak.
The drop was influenced by China’s lack of detailed information regarding its recently announced economic support measures. While China did confirm additional fiscal stimulus over the weekend, it did not specify the extent of these measures.
The daily chart below demonstrates the NZX 50 (NZ50G), where the price returned downside from the September high, 12,850 NZD.

New Zealand’s Manufacturing and Services Slump
In September, the manufacturing sector showed a slight improvement, yet it continued to shrink, marking the 19th month of contraction. The services sector is also struggling, contracting for the seventh consecutive month.
Key stocks like Fisher & Paykel, Infratil, and Spark NZ experienced notable declines, with decreases of 1.1%, 1.2%, and 1.6%, respectively. However, NZX, the market operator, stood out positively by jumping 4.4% after raising its profit forecast for the year.
RBNZ Signals More Cuts
The New Zealand dollar experienced a minor decrease, trading at about $0.609 on Monday. This was due to a strong US dollar and the ongoing uncertainties over China’s economic stimulus details.
Additionally, the economic atmosphere was dampened last week when the Reserve Bank of New Zealand reduced interest rates by 0.5% and suggested that further significant rate cuts might be necessary.
Despite slight improvements in manufacturing, the persistent contraction across both manufacturing and services sectors highlights the broader economic challenges faced by the country.
NZDUSD Technical Analysis – 14-October-2024

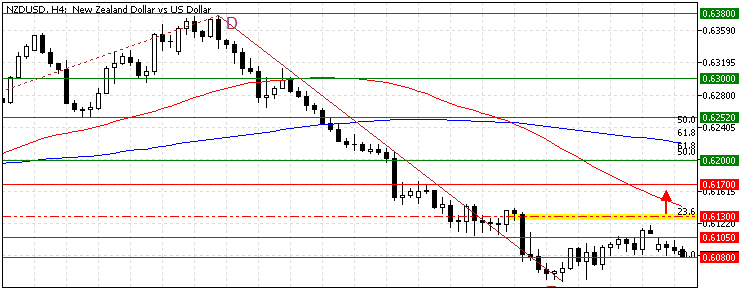
The primary trend is bearish, as the NZD/USD price is below the 50-period simple moving average. Additionally, the Awesome Oscillator gave a wrong bullish signal that the bull market should strengthen. However, the NZD/USD trend failed to surpass the 23.6% Fibonacci and started a consolidation phase below the $0.613 mark.
Overall, the technical indicators suggest the primary trend is bearish and should resume.
NZDUSD Forecast – 14-October-2024

Immediate support is at $0.608 (August 14 High). From a technical perspective, the downtrend will likely resume if sellers close and stabilize the NZD/USD conversion rate below that mark.
If this scenario unfolds, the next bearish target could be revisiting this month’s low at $0.603. Furthermore, if the selling pressure exceeds $0.603, the bears’ path to the August 15 low at $0.597 will likely be paved.
NZDUSD Bullish Scenario

The immediate resistance is at the 23.6% Fibonacci retracement level, the $0.613 mark. If bulls pull NZD/USD above this level, the uptick momentum that began last week from $0.603 could extend to the $0.617 resistance (September 4 Low).
NZDUSD Support and Resistance Levels – 14-October-2024
Traders and investors should closely monitor the key levels below to make informed decisions and adjust their strategies accordingly as market conditions shift.
- Support: $0.608 / $0.603 / $0.597
- Resistance: $0.613 / $0.617 / $0.620