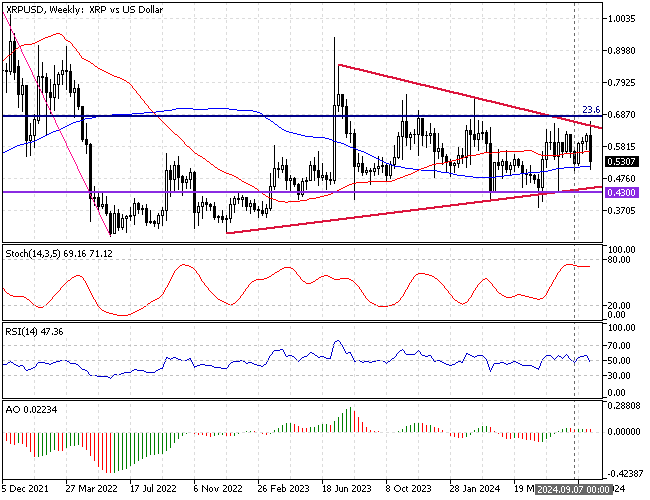
FxNews—Ripple (XRP) dipped from the 23.6% weekly Fibonacci retracement level at $0.664, active resistance. The weekly chart below shows XRP trades sideways between a wide range area, approaching the apex of the symmetrical triangle.
As of this writing, the XRP/USD pair traded at about $0.530, testing the 100-period simple moving average in the weekly timeframe.

Ripple Technical Analysis – Potential Reversal from $0.5

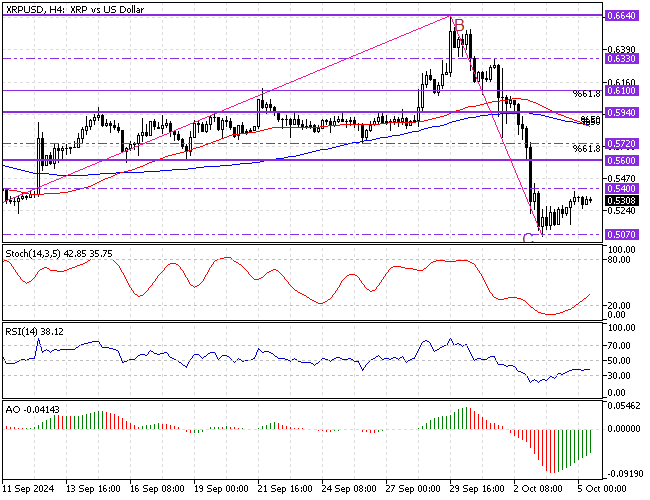
Zooming into the XRP/USD 4-hour chart, we can examine the price action and the technical indicators more closely. We first noticed that Ripple was oversold when the price declined, nearing the September 7 low and the psychological level at $0.5.
The technical indicators signal bullish and suggest the pair will likely erase some recent losses.
- Stochastic depicts 42 in the description, and the value increases, meaning the bull market gains momentum.
- The ‘relative strength index indicator’ backs Stochastic, which flipped above the 20 line, showing signs of bullish momentum.
- The Awesome oscillator histogram is still below the signal line, but the bars are green, and the value rises. This means buyers are pressuring the price.

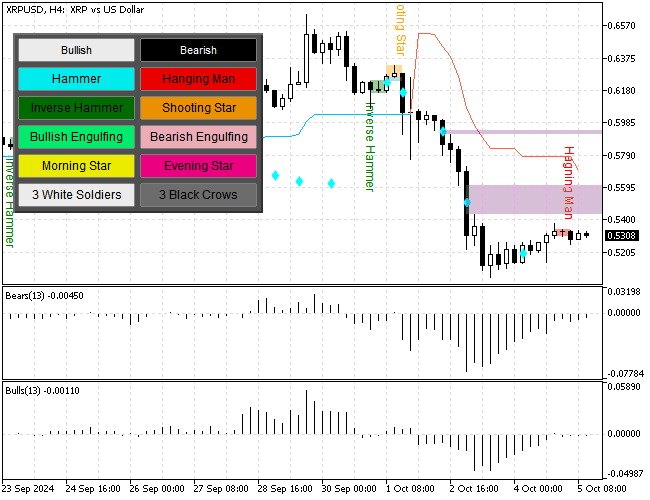
As for the candlestick patterns, the 4-hour chart formed a ‘hanging man’ candlestick, which is a ‘sell’ signal.
Overall, the technical indicators suggest the primary trend is bearish, but the rippling price can increase and fill the ‘fair value gap.’
Ripple Forecast – 5-October-2024

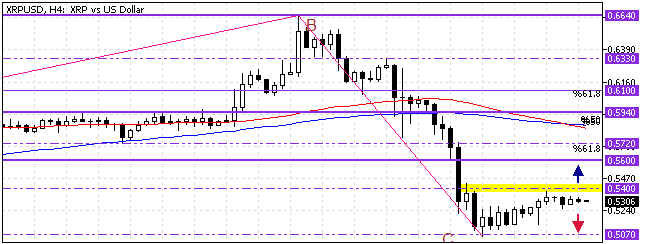
XRP did not complete the test of the $0.50 critical resistance. The price bounced from $0.507, so it could still decline and visit the $0.50 physiological level. In this scenario, the bears should maintain the Ripple price below yesterday’s highest point, the $0.54 mark.
Conversely, if the bulls (buyers) close above $0.54, the uptick momentum from $0.507 can potentially fill the ‘fair value gap’ and test the $0.56 resistance, the 61.8% Fibonacci retracement level.
Ripple Support and Resistance Levels – 5-October-2024
Traders and investors should closely monitor the key levels below to make informed decisions and adjust their strategies accordingly as market conditions shift.
- Support: $0.50 / $0.43
- Resistance: $0.54 / $0.56