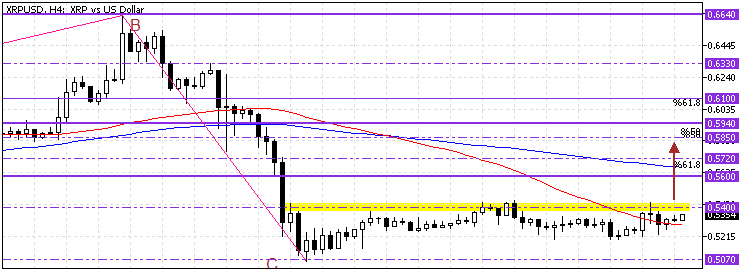
FxNews—Ripple (XRP) trades sideways in a narrow range between the $0.507 immediate support and the $0.540 immediate resistance. As of this writing, the XRP/USD pair trades at approximately $0.533, trying to stabilize above the 50-period simple moving average.
The 4-hour chart below demonstrates the price, support, resistance levels, and technical indicators utilized in today’s analysis.

Ripple Technical Analysis – 11-October-2024

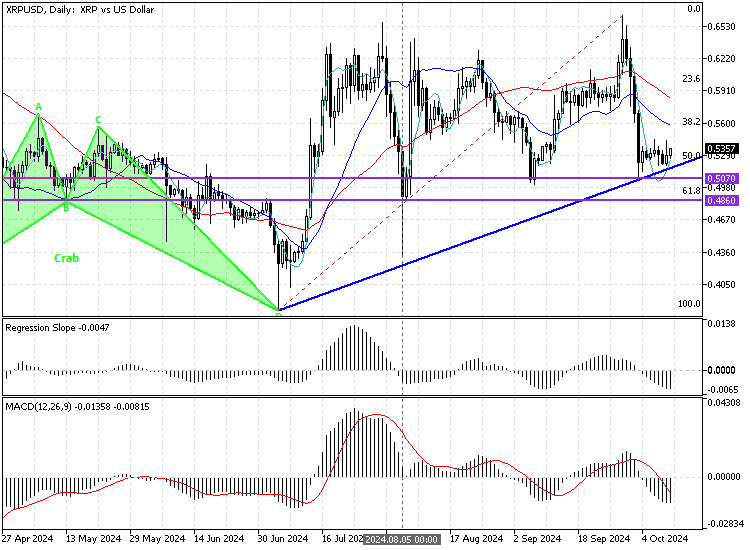
Looking at the daily chart, we notice that the Ripple bulls’ effort is to keep Ripple’s value above the ascending trendline and the $0.507 critical support, a supply zone from which the price bounced multiple times.
XRP Price Forecast – 11-October-2024

From a technical perspective, the uptrend should resume if bulls close and stabilize the XRP/USD above the $0.504 resistance. If this scenario unfolds, the uptick momentum from $0.507 can potentially target the September 16 low at $0.560, backed by the 100-period simple moving average.
Furthermore, if the buying pressure exceeds $0.560, the next resistance area will be the %50 Fibonacci retracement level at about $0.585.
- Also read: Key Indicators Point to Litecoin Price Drop
Ripple (XRP) Bearish Scenario
A new bearish wave could emerge if bears dip the XRP price below the $0.507 resistance. In this scenario, Ripple’s downtrend could extend to the next support level at $0.486, the August 5 closed price.
Ripple Support and Resistance Levels – 11-October-2024
Traders and investors should closely monitor the key levels below to make informed decisions and adjust their strategies accordingly as market conditions shift.
- Support: $0.54 / $0.56 / $0.572 / $0.58
- Resistance: $0.507 / $0.486