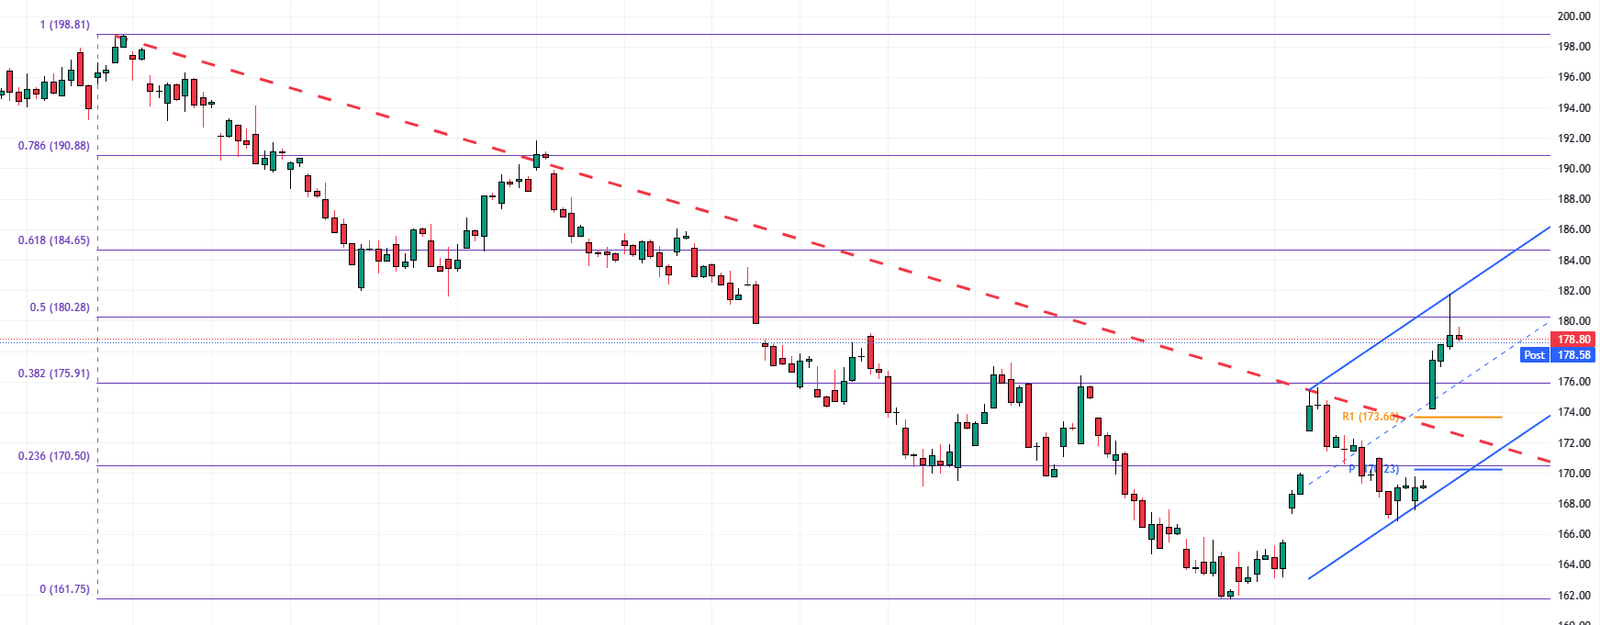
In today’s comprehensive Russel 2000 Index Fund analysis, we will first scrutinize the current economic conditions in Poland. Following that, we will meticulously delve into the details of the technical analysis of the Russel 2000 Index Fund.
Continuing Rise in US Stock
Bloomberg—On a recent Wednesday afternoon, the United States stock market showed a promising upward trend. The well-known Dow Jones Industrial Average, a significant indicator of the market’s health, saw an impressive increase of almost 200 points. Simultaneously, two other major indices, the S&P 500 and the Nasdaq, each experienced growth of over 0.2%. This positive movement in the stock market is especially noteworthy as it follows a period of uncertainty.
This surge in stock prices came right after the release of inflation data, which was more favorable than many had anticipated. Inflation measures how prices rise over time, affecting everything from the cost of living to the value of money. When inflation is high, prices for goods and services increase rapidly. The recent data, however, indicated a slower-than-expected price rise, which is a relief for the economy.
As a result of this development, the likelihood of the Federal Reserve, the U.S. central bank, raising interest rates further diminished significantly. The market is now expecting a reduction in interest rates by as much as 0.5% by July. This change in interest rates is significant because it can influence borrowing costs for individuals and businesses, thereby impacting the economy.
Producer Prices and Retail Sales: A Mixed Picture
In October, the prices that producers receive for their goods and services, known as producer prices, decreased by 0.5%. This drop, the most significant since April 2020, suggests that the pressure from rising prices is easing, which is good news for the economy.
Conversely, a separate report indicated a slight decrease in retail sales, which measure how much consumers spend on goods and services. Sales fell by just 0.1%, less than the expected 0.3% drop. Additionally, sales figures from previous months were revised upward, indicating stronger consumer spending than initially thought. Strong consumer spending is usually a positive sign for the economy, suggesting people are confident enough to spend money.
Sector and Corporate Performance
Regarding specific sectors within the stock market, the financial and material sectors stood out as top performers, showing significant growth. On the corporate front, Target made headlines with its stock price soaring by 17% following a report of profits exceeding expectations. In contrast, Nvidia, a major tech company, saw its stock decline by over 1%, ending its 10-day streak of gains.
Looking forward, two tech giants, Palo Alto Networks and Cisco, are scheduled to announce their earnings. These announcements are closely watched as they can provide insights into the companies’ health and prospects.
Economic Implications
The overall picture painted by these developments is generally positive for the economy. The rise in stock prices reflects investor confidence, which can stimulate more investment and economic growth. The cooling inflation data suggests a more stable financial environment, which benefits long-term economic planning and stability. However, monitoring the balance between consumer spending and inflation is important. While easing inflationary pressure is good, sustained drops in retail sales could signal weakening consumer confidence, which can concern economic growth.
Russel 2000 Index Fund Analysis
The Russell 2000 index fund has extended bullish momentum, reaching as high as $182, following a breakout from the bearish trendline. This peak aligns with the 50% Fibonacci retracement level, indicating a significant resistance point. Additionally, the RSI (Relative Strength Index) indicator is overbought territory. Notably, a minor divergence is visible on the 4-hour chart, suggesting potential changes in the trend.

Given that the chart has formed a long wick candlestick pattern, it is likely that the index could undergo a correction with a price decrease. The first support level to watch is the 38.2% Fibonacci retracement level, followed by the R1, which stands as a support at $173.
Conversely, Should the bulls close above $181, this would invalidate the bearish scenario, shifting the market sentiment towards a continued uptrend.