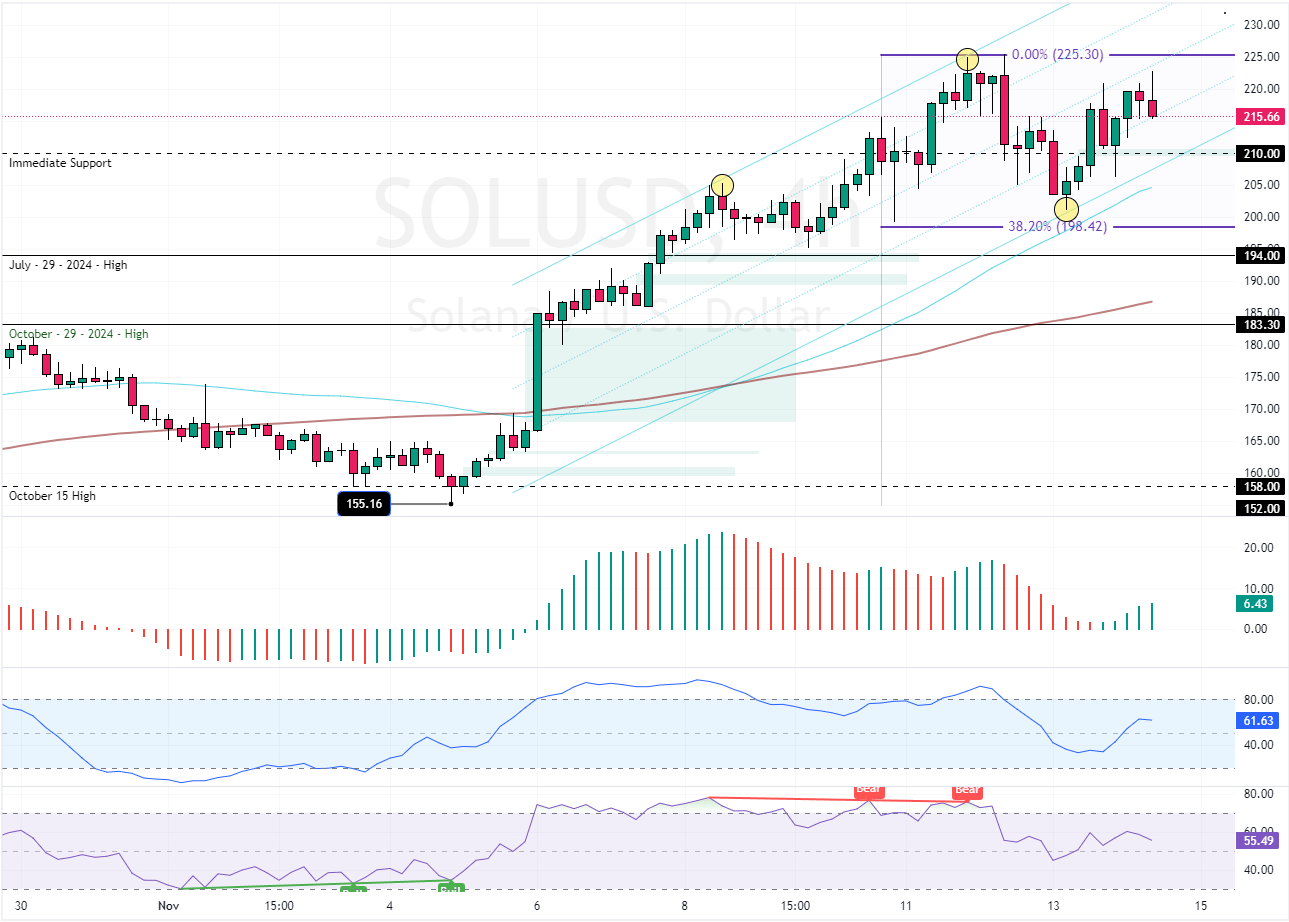
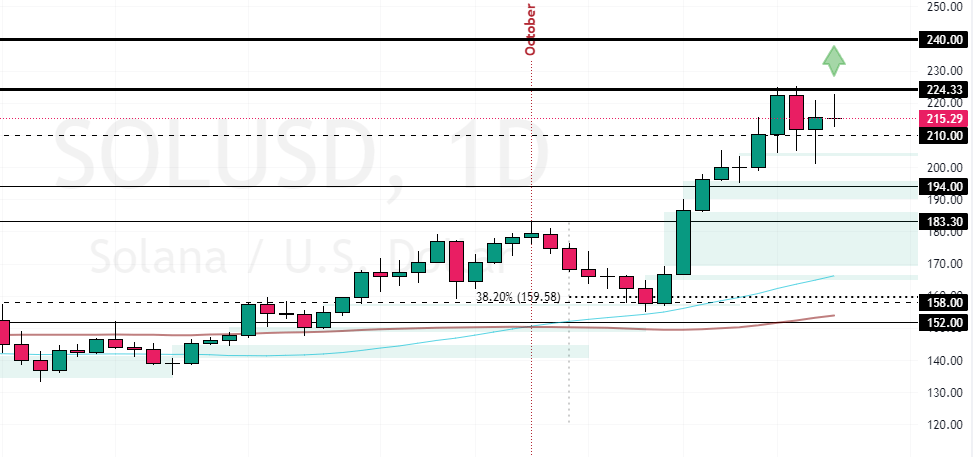
FxNews—Yesterday, Solana prices bounced from the 38.2% Fibonacci retracement level ($198.4) and resumed their bullish trajectory. As of this writing, the crypto pair is testing the November 11 high at $225.3.
The SOL/USD 4-hour chart below demonstrates the price, support, and resistance levels and the technical indicators utilized in today’s analysis.

Green Bars Signal Bull Trend is Here to Stay
The primary trend is bullish because the prices exceed the 50-period simple moving average. Furthermore, the Awesome Oscillator is above the median line with green bars, indicating the bull market should prevail. Meanwhile, the Stochastic and RSI depict 61 and 55 in the description, meaning the bull market should resume.
Overall, the technical indicators suggest the primary trend is bullish and should resume.
Solana Bull Run Hinges on Key $198 Level

The immediate critical support that decides the bull market from the bear market stands still at $198 (38.2% Fibonacci retracement level). That said, the Solana trend outlook should remain bullish as long as the prices exceed the critical support.
From a technical perspective, the uptrend will likely resume if bulls close and stabilize the price above the immediate support at $225.3. In this scenario, the bulls’ path to the $240 physiological level could be paved.
Please note that the bullish strategy should be invalidated if Solana falls below the 38.2% Fibonacci. If this occurs, the prices can potentially dip to the $183.3 resistance.
- Support: 198.4 / 183.3
- Resistance: 225.3 / 240.0