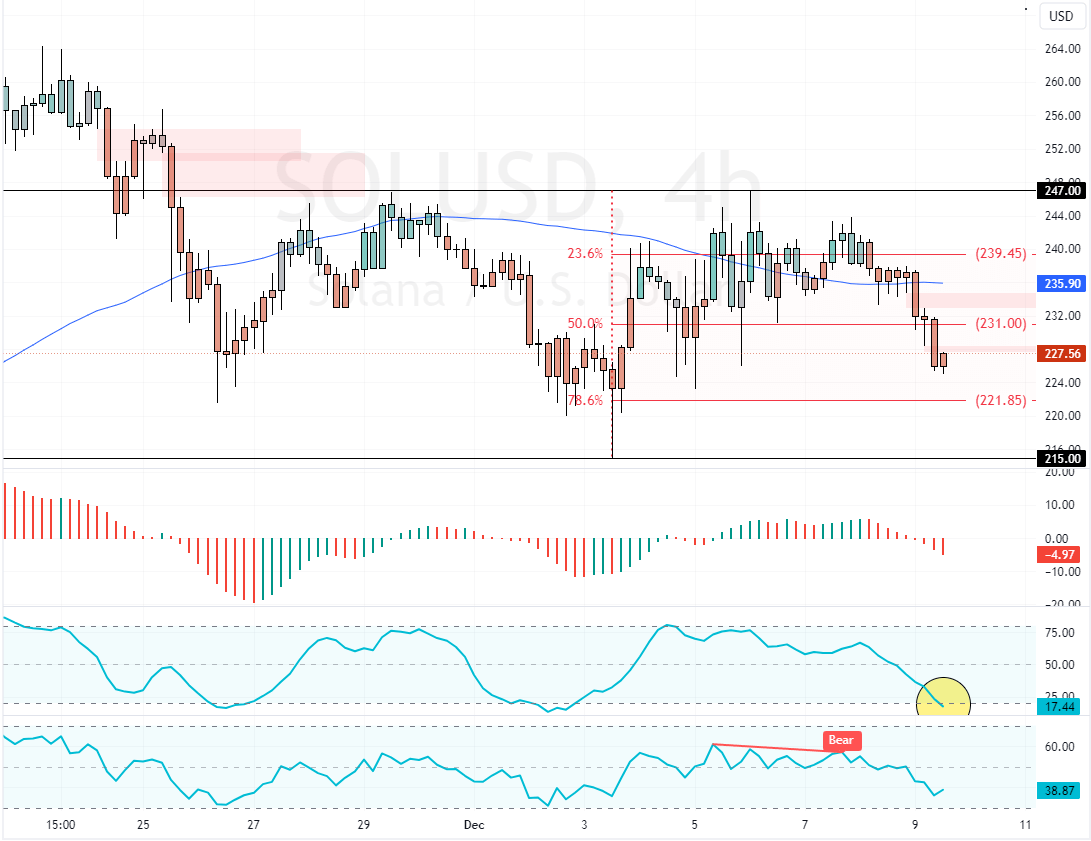
FxNews—Solana flipped below the 75-period simple moving average in today’s trading session, causing prices to dip below the $231.0 pivot. This decline was hinted at in the previous week’s session when RSI 14 signaled divergence.
Furthermore, the recent decline in cryptocurrency‘s value drove the Stochastic Oscillator into oversold territory, meaning the downtrend might ease soon.

Solana Technical Analysis – 9-December-2024
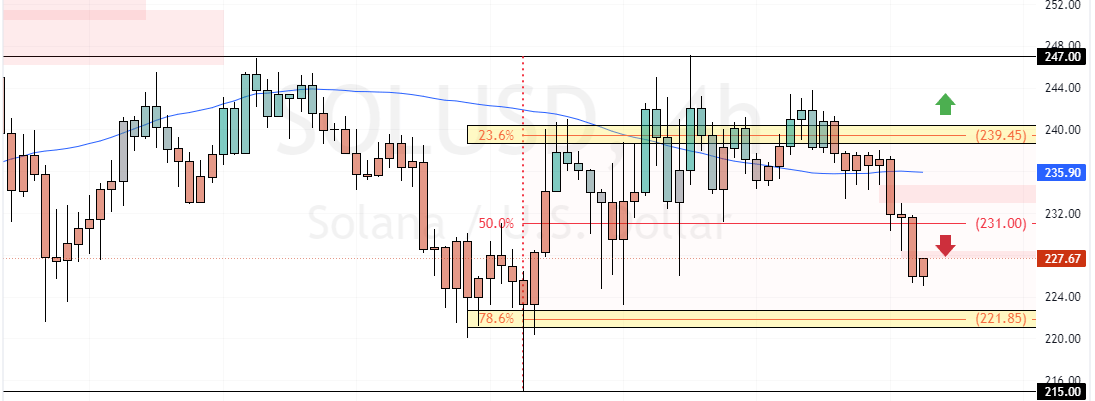
The immediate resistance is $231.0 in conjunction with the 50.0% Fibonacci retracement level. From a technical perspective, the next bearish target could be the 78.6% Fibonacci support level if Solana remains below the immediate resistance.

Furthermore, if the selling pressure exceeds $221.0, SOL/USD’s bearish momentum could spread to the December 3 low at $215.0.
The Bullish Scenario
Please note that the bearish outlook should be invalidated if SOL/USD prices shift above the 23.6% Fibonacci resistance level at $239.0. If this scenario unfolds, the trend can potentially change to bullish, targeting the $247.0 mark.