FxNews—Solana has traded sideways in a narrow range between $120 and $136 since August 29. As of this writing, the ADA/USD pair has closed below the 50- and 100-period simple moving average, trading at approximately $131.5 in today’s trading session.
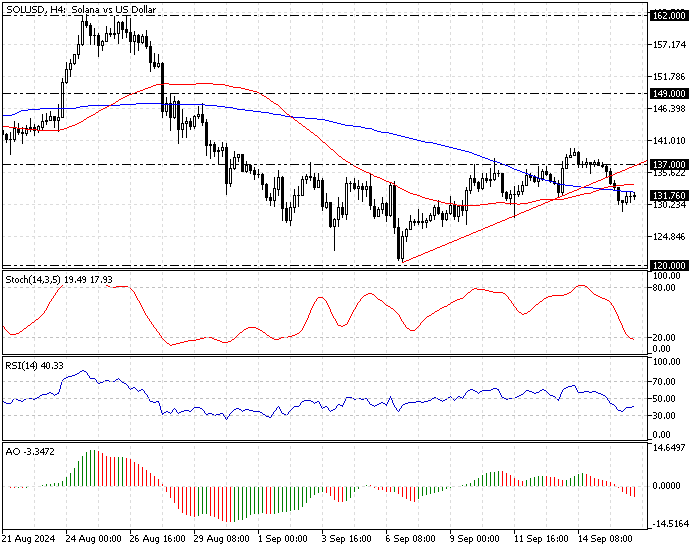
The 4-hour chart below demonstrates the Solana price, support, resistance levels, and the technical indicators used in today’s analysis.

Solana Technical Analysis – 16-September-2024
The image above shows that the SOL/USD price dipped below the ascending trendline and the moving averages. Concurrently, the awesome oscillator bars turned red and below the signal line. On the other hand, the Stochastic oscillator shows 19 in the description, indicating Solana is oversold.

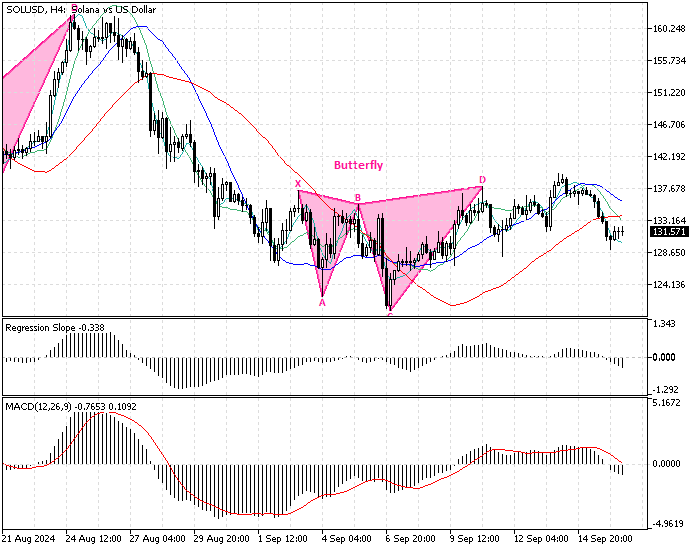
As for the harmonic pattern, we notice that the 4-hour chart formed a bearish butterfly pattern, which is a sell signal.

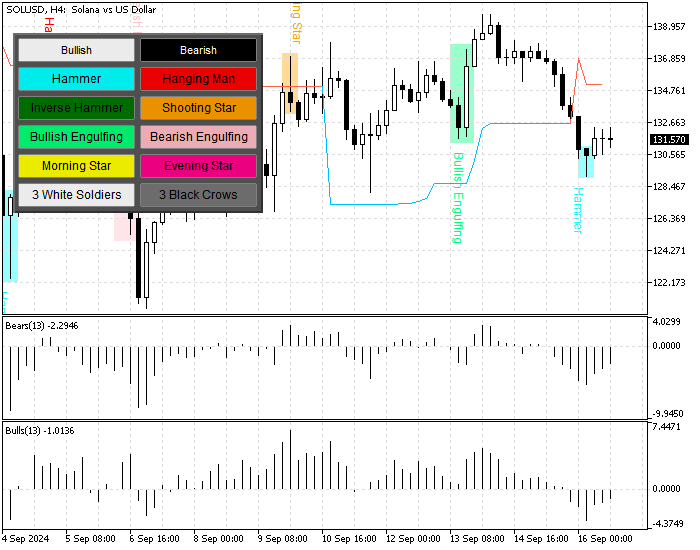
In addition to the harmonic pattern, the SOL/USD price is below the Super trend indicator now, meaning a new bearish wave could be imminent.
Overall, the technical indicators suggest the primary trend is bearish, and the price can dip to lower support levels after a minor consolidation.
Solana Price Forecast
Immediate resistance rests at $137. The bear market will remain valid if the ADA/USD price holds below this barrier. In this scenario, the downtrend that began at $140 (September 14 High) will likely extend to the September 6 low at $120.
Furthermore, if the selling pressure pushed the Solana price below $120, the August 2024 low at $109 will be the next supply zone. Please note the bearish scenario is invalidated if the Solana price exceeds $137.
Solana Bullish Scenario
If the bulls or buyers close and stabilize the price above $137, the path to the $149 (August 20 High) will likely be paved. Furthermore, if the price exceeds $149, the next bullish target could be the August 24 high at $162.
Please note that the 100-period simple moving average will play the primary support for the bullish scenario.
Solana Support and Resistance Levels
Traders and investors should closely monitor the key levels below to make informed decisions and adjust their strategies accordingly as market conditions shift.
- Support: $120 / $109
- Resistance: $137 / $149 / $162