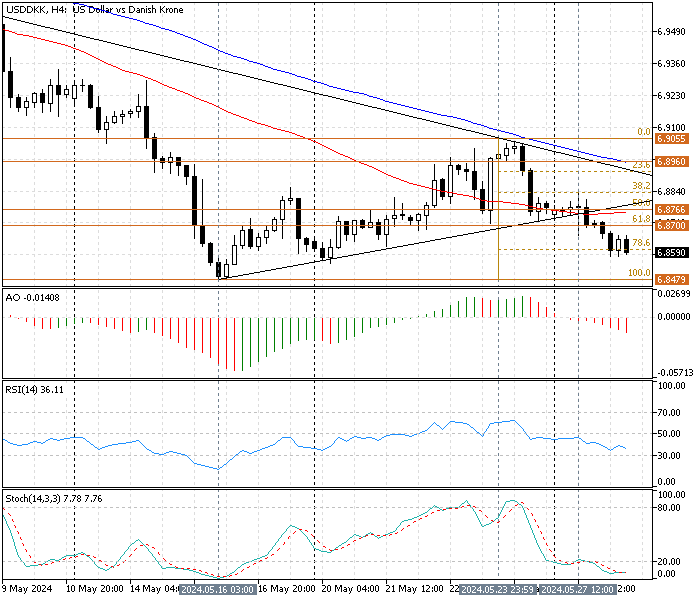
FxNews—The Danish Krone broke below the ascending trendline and the May 27 low at $6.86 against the U.S. Dollar. As of writing, the USD/DKK trades are near the 78.6% Fibonacci retracement level at $6.85.
USD/DKK Technical Analysis 4-Hour Chart

The primary trend is bearish because the price floats in a downtrend below SMA 50 and SMA 100 in the 4-hour chart. The awesome oscillator shows a value of -0.014 with red bars below the signal line. This decline in the AO suggests the downtrend prevails.
- The relative strength index indicator is below the median line, depicting 36 and declining, adding credit to the current downtrend.
- The stochastic oscillator provides valuable insight into the current price action. The %K line value is in the oversold territory, showing 7 in the description, signifying the market is extremely oversold, and the trend might reverse or consolidate.
These developments in the technical indicators in the 4-hour chart suggest the downtrend will likely resume, but a consolidation phase to the upper support level might be imminent.
USD/DKK Technical Analysis 1-Hour Chart

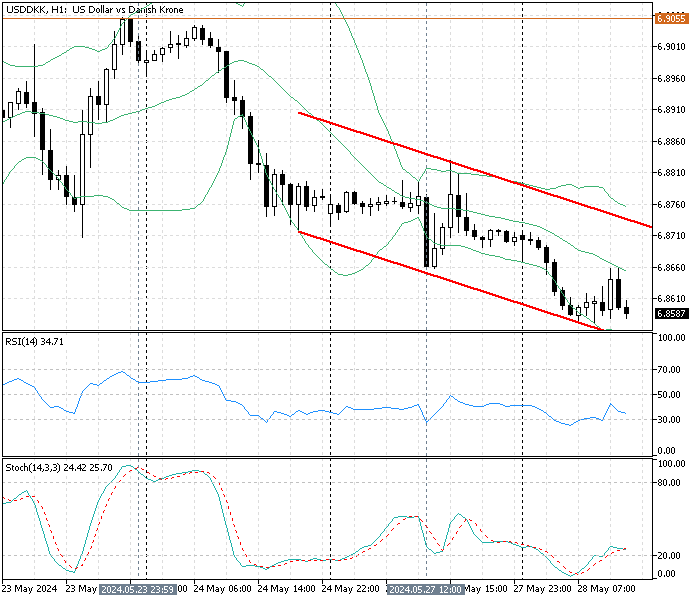
The one-hour chart provides a detailed analysis of the price action and momentum indicators such as stochastic and RSI. As shown in the image above, the American dollar had a slight pullback upon touching the lower band of the Bollinger indicator. As a result, the price reached the middle line of the indicators, and consequently, it returned to the downside, trading at $6.85. This means the bearish bias prevails, and the selling pressure is robust.
- On the other hand, the stochastic oscillator stepped outside of the oversold territory, recording 25 in %K line, signifying the market was oversold and is correcting.
- The RSI signal supports the Stochastic oscillator. The indicators show a value of 34 and moved outside the oversold area in today’s trading session.
These developments in the technical indicators in the 1-hour chart suggest the primary bearish trend is robust despite the bulls’ attempt to correct. That said, according to the data received from the USD/DKK 1-hour chart, the downtrend will likely resume.
USD/DKK Forecast – May-28-2024

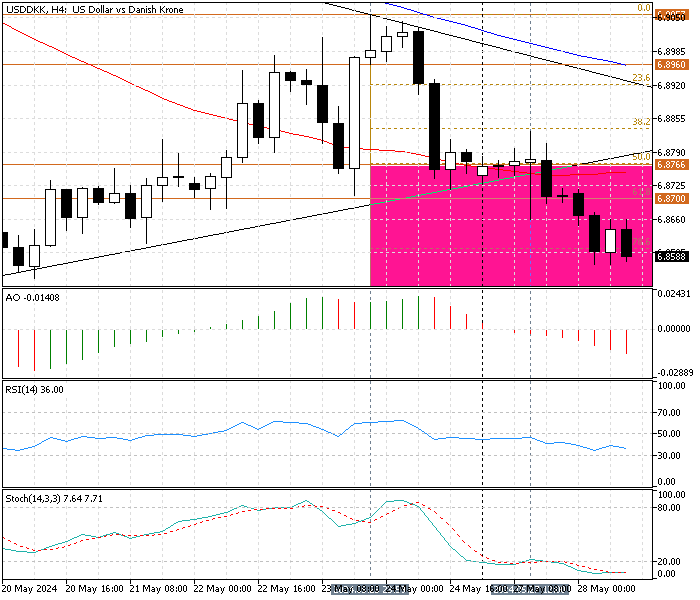
From a technical standpoint, the primary trend is bearish, and selling pressure escalated after the price broke below the 61.8% Fibonacci level at $6.87. The next bearish target will likely be the May 16 low at $6.84. For this scenario, the Danish Krone should remain below the simple moving average of 100 against the U.S. Dollar.
Please note that the stochastic oscillator in the 4-hour chart warns of an oversold market. Therefore, we do not recommend joining the bear market in this situation, regardless of the seller’s target of $6.84. Executing a sell order at the current market price is risky since the stop loss should be set above SMA 50 at $6.89, far from the current quote.
We advise waiting patiently for the U.S. Dollar to erase some of its recent loss by raising the price to the critical resistance level of $6.87. The key support level is backed by the %50 Fibonacci support and the broken ascending trendline. This level offers a decent demand area to join the bear market gradually, with the target at $6.84.
USD/DKK Bullish Scenario
If the bulls push the USD/DKK price beyond the May 23 high, the bearish outlook should be invalidated. The $6.93 support could be set as the next bullish target if this scenario occurs.
Disclaimer: This technical analysis is for informational purposes only. Past performance is not necessarily indicative of future results. Foreign exchange trading carries significant risks and may not be suitable for all investors. Always conduct your research before making any investment decisions.