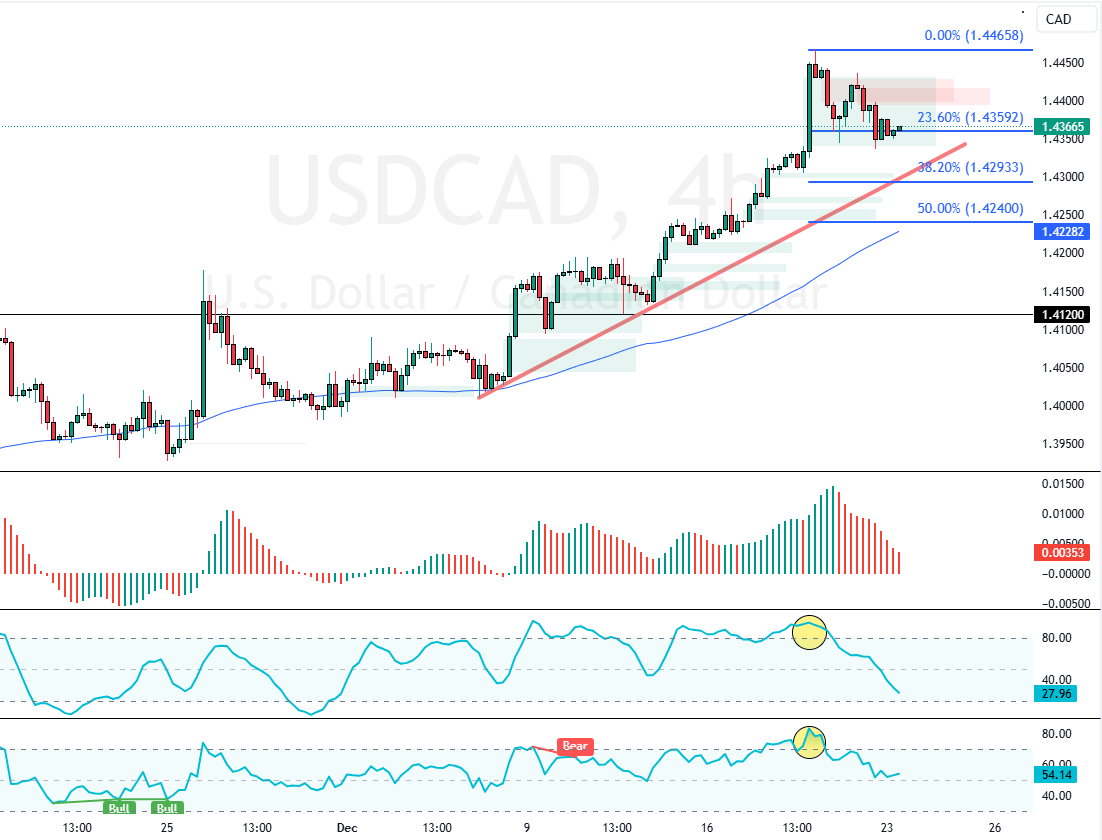
USD/CAD is in a robust bull market and began consolidating near the 23.6% Fibonacci support level. The current downtick in momentum was expected because Stochastic and RSI 14 were hovering in overbought territory when the pair was at its monthly peak (1.446).
As of this writing, the currency pair trades at approximately 1.435, testing the bullish fair value gap area as the support zone.

USDCAD Technical Analysis – 23-December-2024
The technical indicators hint at the bull market weakening. The Awesome Oscillator histogram is red, above zero. Meanwhile, the Stochastic Oscillator depicts 27 in the description, nearing the oversold territory.
On the other hand, RSI 14 is still above the median line, pointing to a bull market. Besides the momentum indicators, the primary trend should be considered bullish because prices above the 75-period SMA.
Overall, the technical indicators suggest the primary trend is bullish and should resume after a minor consolidation.
USDCAD to Surge If Bulls Top 1.446

The immediate support is at the 38.2% Fibonacci level, the 1.429 mark. Above this level, the USD/CAD trend outlook remains bullish.
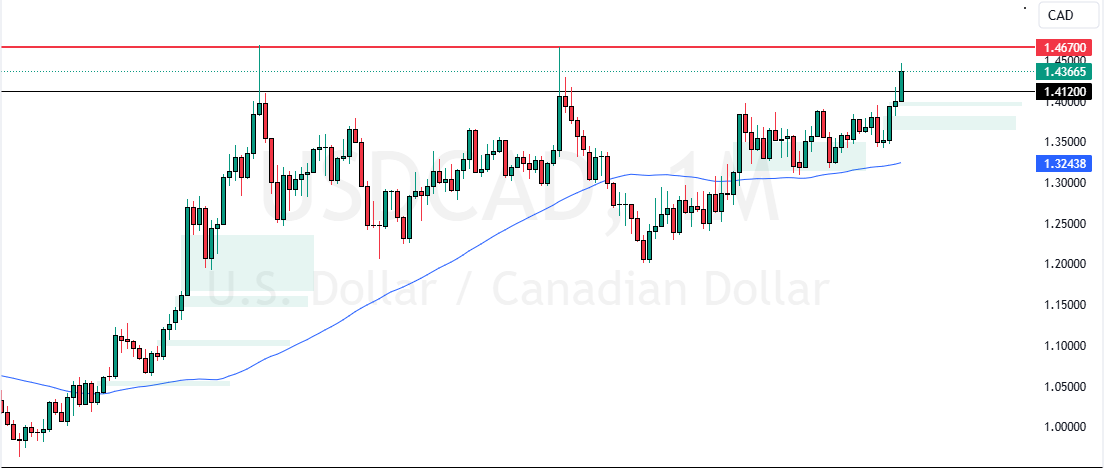
But for the uptrend to resume, bulls must close and stabilize above the 1.446 high. If this scenario unfolds, the next bullish target could be 1.467.
The Bearish Scenario
Please note that the bullish outlook should be invalidated if USD/CAD falls below 1.429. In this scenario, the consolidation phase could extend to 1.424, critical support backed by the 75-period SMA.