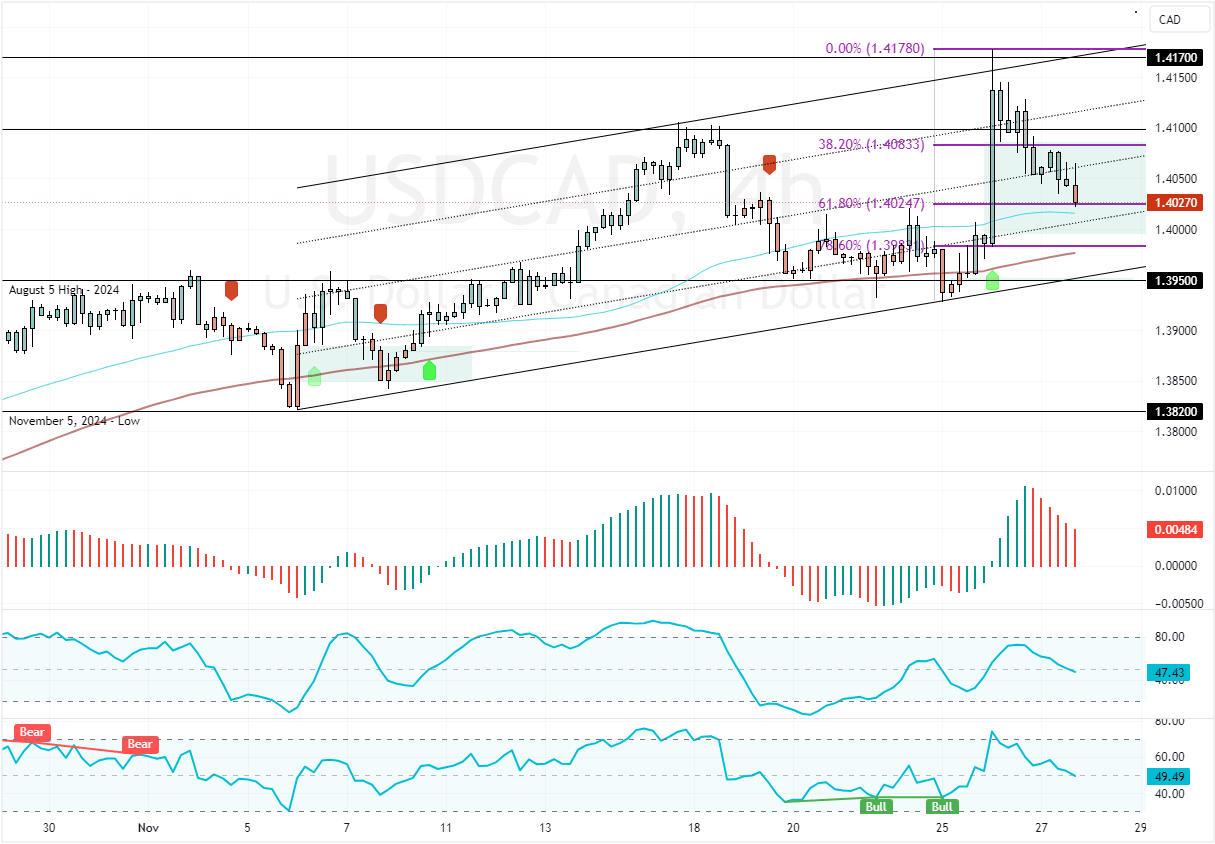
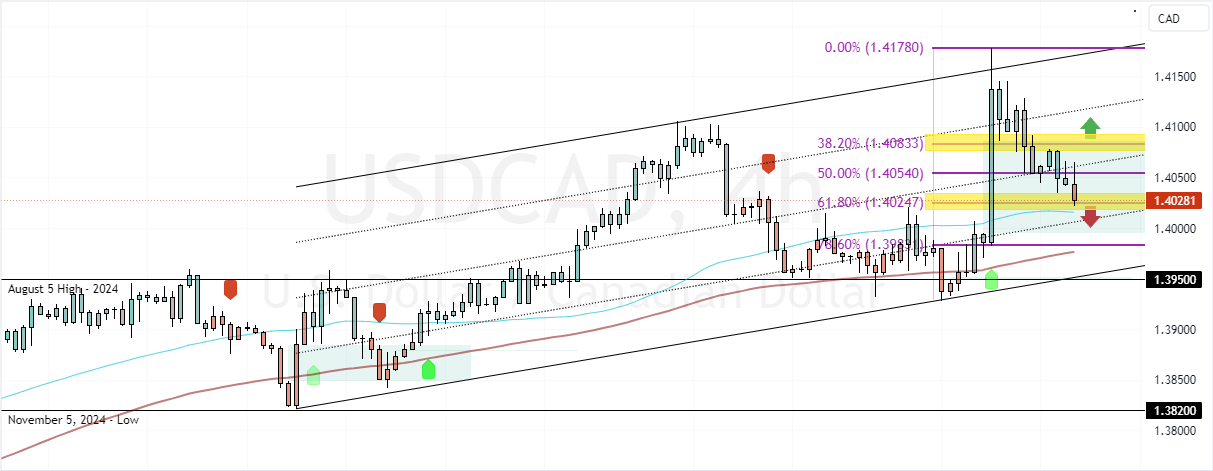
FxNews—The USD/CAD pair dipped from 1.417 in conjunction with the upper line of the bullish flag. As of this writing, the currency pair trades at approximately 1.402, testing the 61.8% Fibonacci level as support.
Bearish Indicators Emerge Above Key Moving Averages

As for the technical indicators, the Awesome Oscillator histogram is red and declining toward zero. Meanwhile, the Stochastic and RSI 14 values are decreasing, depicting 47 and 49 in the description, respectively.
However, the primary trend should be considered bullish, as the prices are about the 50- and 100-period simple moving averages.
Overall, the technical indicators suggest while the primary trend is bullish, USD/CAD could dip toward lower support levels.
USDCAD Eyes Further Losses Below 1.402 Support

USD/CAD’s immediate support is at 1.402, the 61.8% Fibonacci level and the immediate resistance rests at 1.405, the 50% Fibonacci level.
From a technical perspective, the current downtrend could resume if sellers push USD/CAD below the immediate support (1.402). In this scenario, the bearish momentum could extend to the 78.6% Fibonacci level at 1.398.
Bullish Scenario
On the other hand, the uptrend will likely resume if USD/CAD closes above the 1.407 critical resistance, neighboring the 38.2% Fibonacci. If this scenario unfolds, the USD/CAD bulls could target the November high at 1.417.