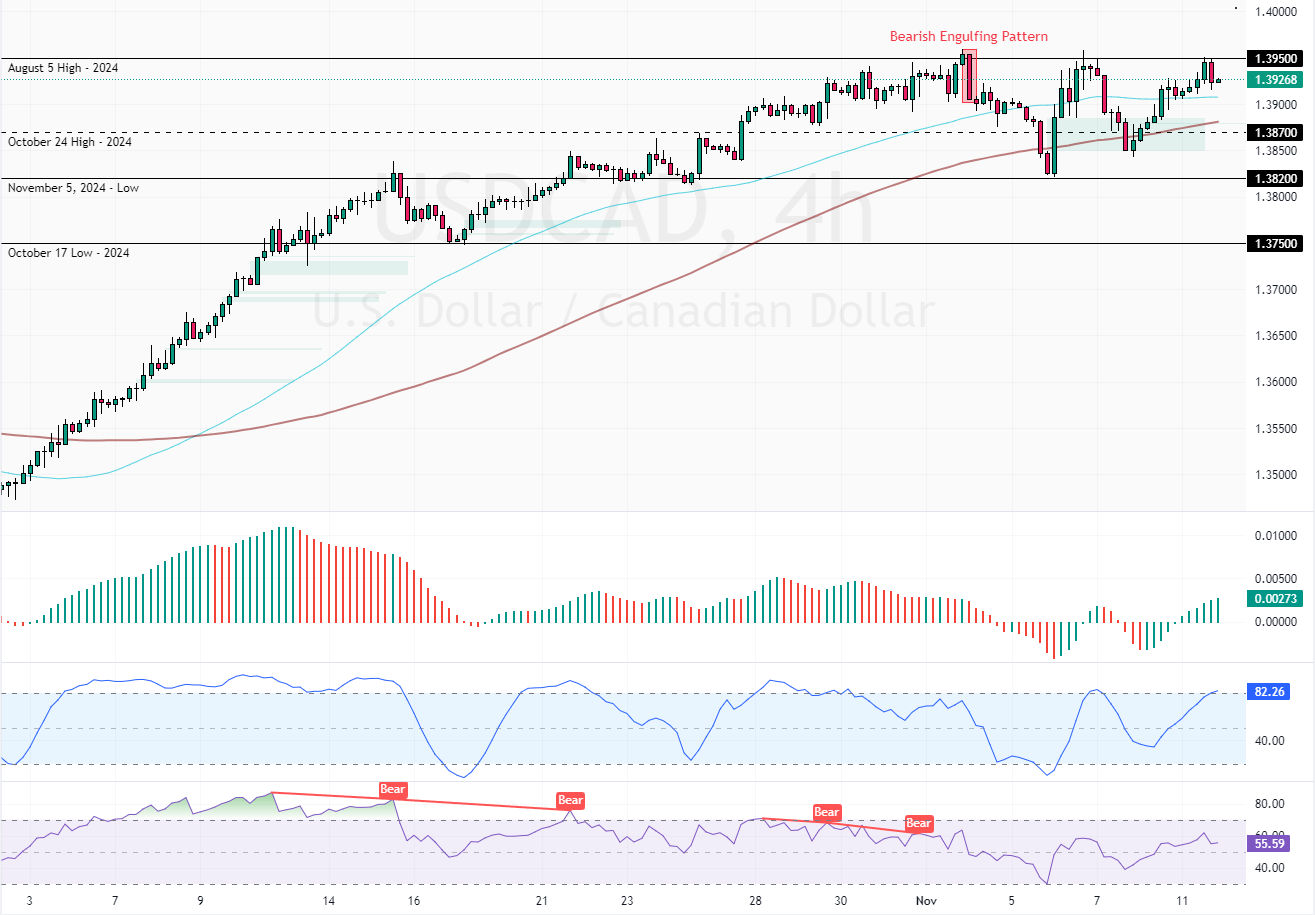
FxNews—The U.S. dollar trades in an uptrend against the Loonie at approximately 1.391, above the median line of the Bollinger band. Last week, on Monday, November 4, the 4-hour chart formed a bearish engulfing pattern, which caused the Canadian dollar to erase some of its loss, which did not last long.
Consequently, the USD/CAD bullish trajectory resumed from 1.382, testing the 1.395 critical resistance as of this writing.
The 4-hour chart below demonstrates the price, support, and resistance levels, as well as the technical indicators utilized in today’s analysis.

USDCAD Technical Analysis – 11-November-2024
As for the technical indicators, the Stochastic Oscillator stepped into overbought territory, depicting 82 in the description, meaning the U.S. dollar is overpriced in the short term.
The Awesome Oscillator and RSI also show bullish signals, meaning the primary trend is bullish and should resume.

Overall, the technical indicators suggest that while the primary trend is bullish, the USD/CAD price can consolidate before the uptrend resumes.
USDCAD Forecast – 11-November-2024
The August 5 high at 1.395 is the immediate resistance that has prevented the uptrend from resuming. From a technical perspective, the uptrend will likely resume if the bulls pull the USD/CAD price above this resistance. In this scenario, the USD/CAD’s path to the %78.6 Fibonacci retracement level at 1.409 will likely be paved.
- Next read: Sellers May Drive NZDUSD Below $0.595 Soon
Please note that the critical support dividing the bull market from the bear market stands at 1.382, and the bullish scenario should be invalidated if USD/CAD falls below this level.
- Support: 1.387 / 1.382
- Resistance: 1.395 / 1.409