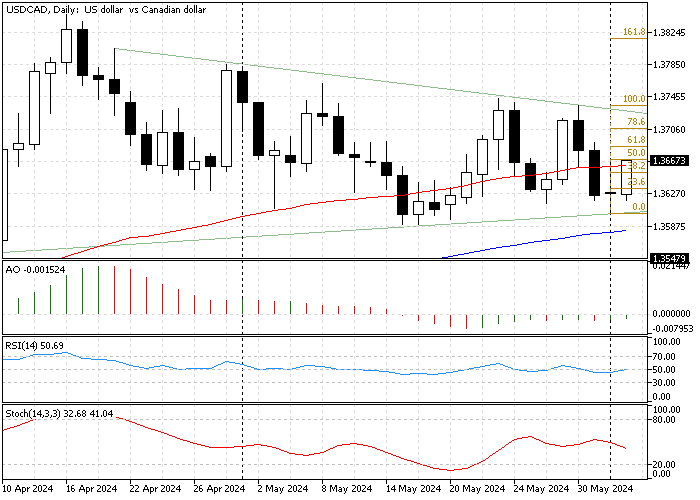
In today’s trading session, the American dollar traded at about $1.365 against Canadian money. USD/CAD has been trading sideways since late April 2024, and as of this writing, the trend is slowing down as it approaches the apex of the symmetrical channel.
The USD/CAD daily chart below shows the symmetrical triangle, moving averages, and technical indicators.

USDCAD Technical Analysis – 4-June-2024
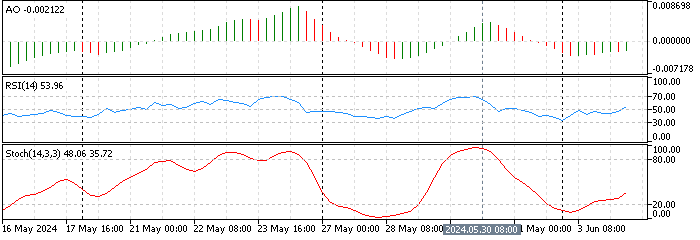
As depicted in the 4-hour chart below, the currency pair’s price decline paused at the $1.360 mark, a supply zone in conjunction with the May 20 low. Furthermore, the downtrend began on May 30, driving the stochastic oscillator into the oversold area. Consequently, today’s pullback from $1.360 was expected.

As of this writing, the USD/CAD bulls are determined to test the 50% Fibonacci retracement level at $1.366. Furthermore, the technical indicators suggest that the currency pair is in a sideways market with bullish tendencies.
- The awesome oscillator’s recent bar turned green, but they are below the signal line, recording -0.002 in the value. This means the bearish momentum weakens.
- The relative strength index indicator returns the median line, indicating that bearish momentum weakens as the uptrend strengthens.
- The stochastic oscillator stepped outside the oversold territory, depicting 35 in the description. This growth in the indicator’s value signifies the U.S. Dollar might erase some of its losses against the Canadian dollar.

USDCAD Technical Indicators 4-Hour Chart
USDCAD Forecast – 4-June-2024
The USD/CAD trades sideways between the key resistance at $1.360 and the critical resistance level at $1.373. With the current bullish momentum, the pair could test the key resistance at $1.373 for the third time in the last 30 trading days.
For this scenario, the USDCAD bulls must close and stabilize the price above the SMA 50 in the 4-hour chart. In this case, the next target for the buyers will be the 78.6% Fibonacci at $1.370, followed by May 30 high at $1.373.
Please note that the 23.6% Fibonacci at $1.3633 supports the bullish scenario. If this level is breached, the bullish analysis should be invalidated accordingly.
Bearish Scenario
The key resistance is at $1.360, backed by the ascending trendline. If the USD/CAD price dips below this level, the downtrend will likely resume, and the next support will be at $1.354.
Please note that the %50 Fibonacci retracement level at $1.366 plays the resistance to the bearish scenario.
USD/CAD Key Support and Resistance Levels
Traders and investors should closely monitor the key levels below to make informed decisions and adjust their strategies accordingly as market conditions shift.
- Support: $1.363 / $1.360
- Resistance: $1.366 / $1.368 / $1.370 / $1.373