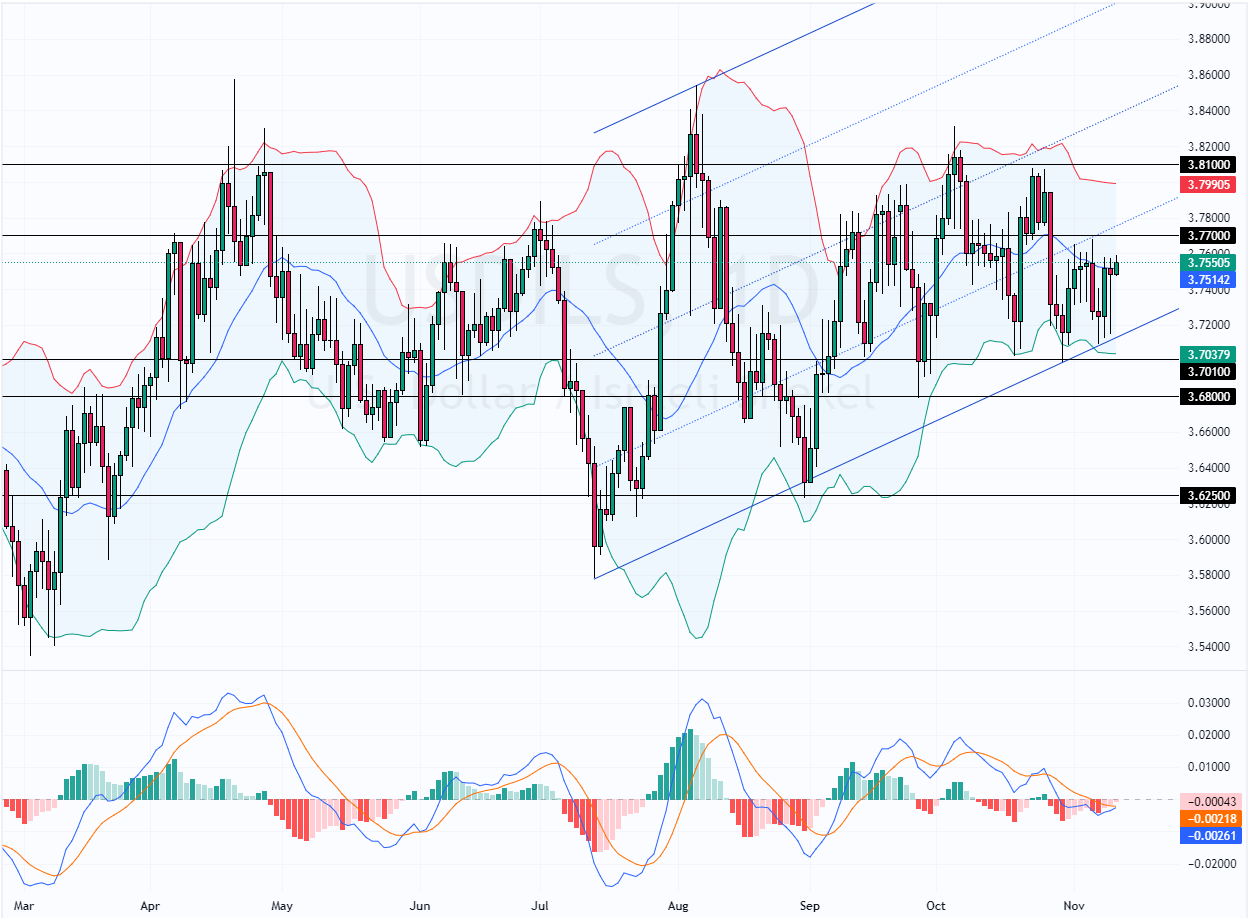
FxNews—The American currency has been trading sideways against the Israeli shekel since October 29. The primary trend is bullish because the daily chart shows that the USD/ILS price is above the 100-period simple moving average and within the bullish flag.
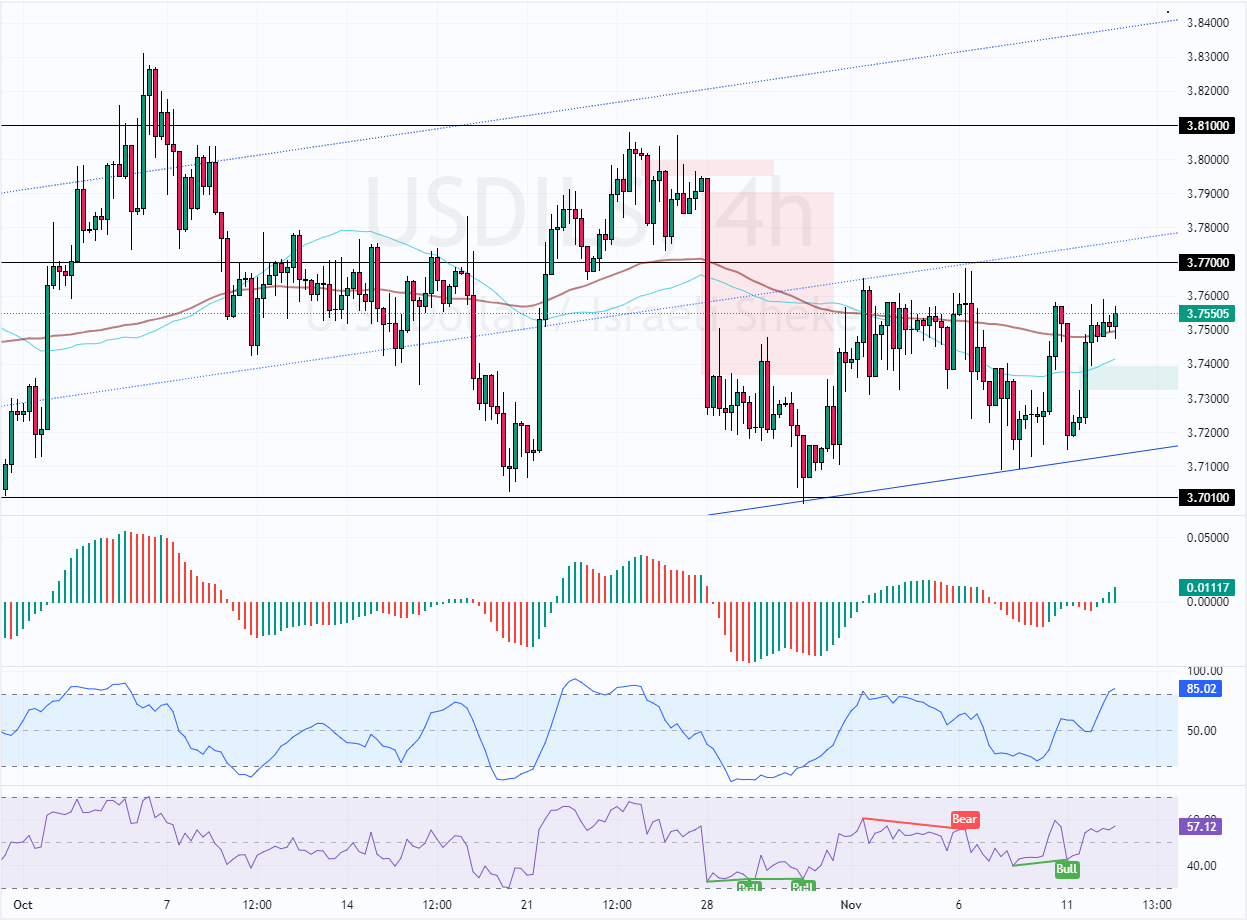
As of this writing, the currency pair trades at approximately 3.756 after the pullback from 3.70.

USDILS Technical Analysis – 12-November-2024
In the previous technical analysis about USD/ILS (USDILS Bears Pushes Lower Under Key 3.77 Resistance), we predicted that the price would decline toward the 3.701 resistance. That forecast happened, and consequently, the price bounced from the 3.701 resistance as expected because the RSI 14 indicator signaled divergence at that time.

Currently, the bulls are trying to stabilize the USD/IL price above the 50- and 100-period simple moving averages. Still, the Stochastic Oscillator signals oversold, which could cause the exchange rate to dip again.
Overall, the technical indicators suggest the USD/ILS pair trades sideways in a wide range area, and it has the potential to decline toward lower support levels.
USDILS Forecast – 12-November-2024

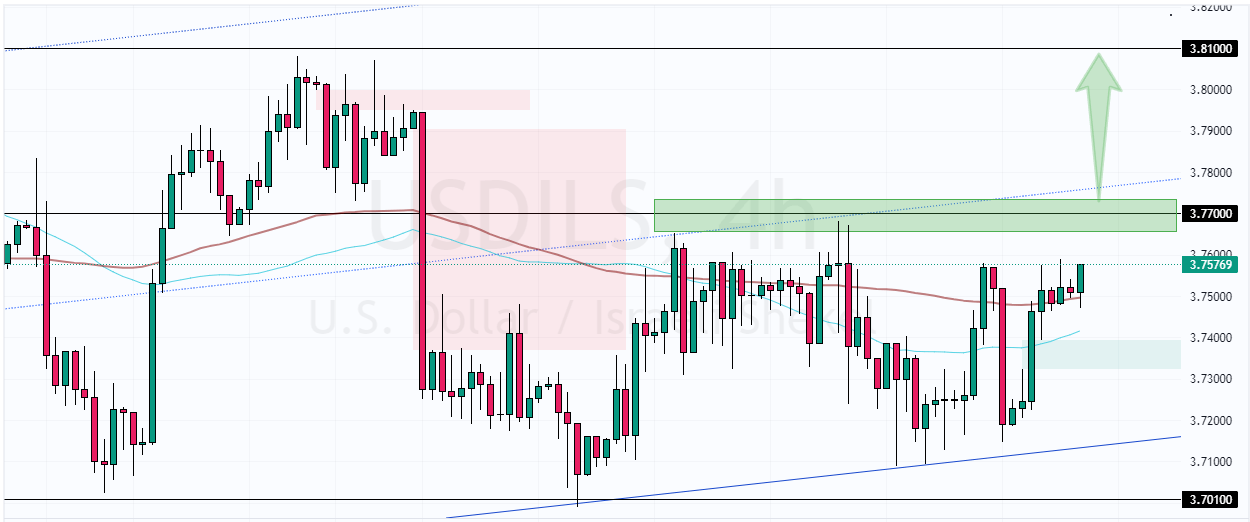
The USD/ILS trend outlook remains bullish above the 3.701 support. That said, the immediate resistance holds strong at 3.77. From a technical perspective, the uptrend will likely resume if bulls pull the USD/ILS price above the immediate resistance. In this scenario, the pair’s conversion rate could extend to the 3.81 resistance.
Please note that the USD/IL price has the potential to consolidate before aiming to break the 3.77 resistance. Additionally, the bullish strategy should be invalidated if USD/ILS falls below 3.701.
- Support: 3.701 / 3.68 / 3.625
- Resistance: 3.77 / 3.81 / 3.85