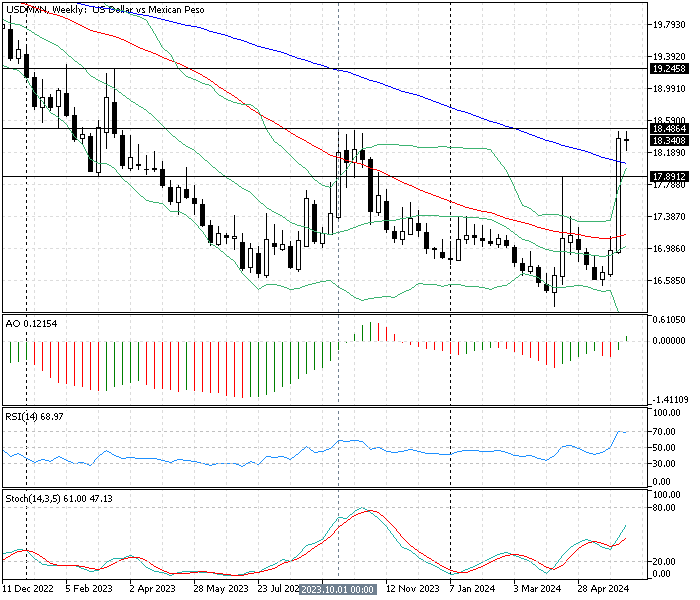
FxNews—The American currency, the Dollar, closed above the weekly simple moving average of 100 against the Mexican peso on Friday. That is near the 18.25 critical resistance level that has paused the strong bullish trend. This development in the USD/MXN price has driven the price above the Bollinger band, a sign of an overbought market.
The weekly chart below shows the vital resistance level and the critical technical indicators utilized in today’s USD/MXN analysis.

USDMXN Technical Analysis – 10-June-204

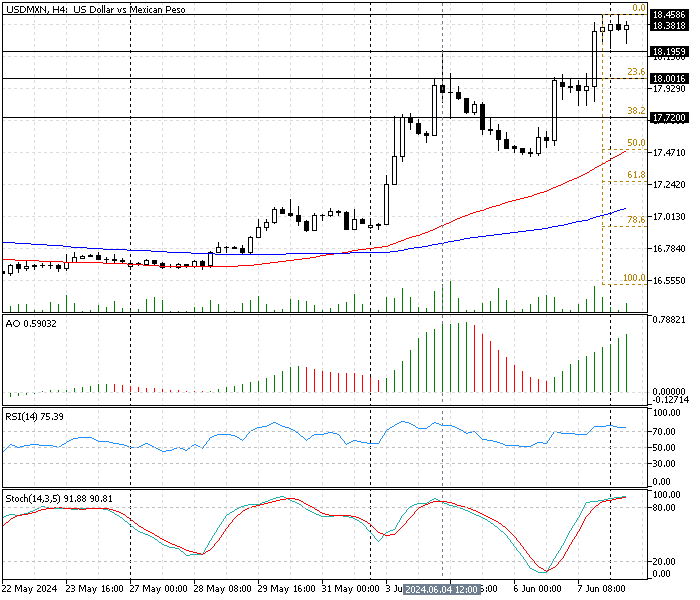
As of this writing, the U.S. Dollar traded at approximately 18.33, close to the key resistance level at 18.45. The robust uptrend has driven the momentum oscillators into overbought territory.
- The stochastic oscillator value is 90, hovering in the overbought zone, signifying the uptrend should ease, and the trend might reverse or consolidate anytime soon.
- The relative strength index indicator value is 74. That’s above 70, which is the overbought zone. This growth in the RSI (14) means the U.S. dollar is overpriced against the peso, and there is a high possibility that the Mexican currency will erase some of its recent losses.
- The awesome oscillator bars are in full green and above zero, signaling the uptrend is robust and should resume.
These developments in the technical indicators in the USD/MXN 4-hour chart suggest the primary trend is bullish. Still, the market is overbought, and a trend reversal or consolidation in price could be imminent.
USDMXN Forecast – 10-June-2024

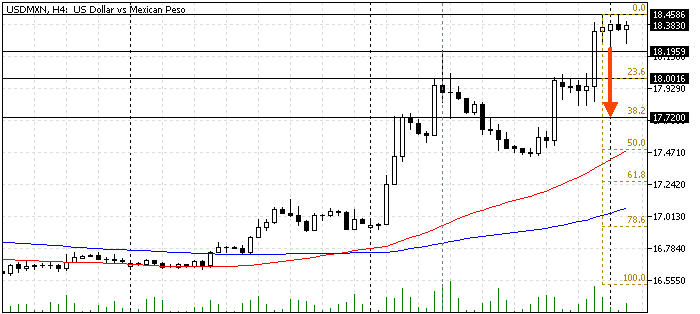
The key resistance level is 18.25, while the immediate support is the June 4 high at 18.19. From a technical perspective, the USD/MXN price is overbought. If the bears cross below the immediate resistance, the dip will likely extend to the 23.6% Fibonacci level at 19.0. Furthermore, if the selling pressure exceeds this level, the decline could target the 38.2% Fibonacci level at 17.72.
The resistance for the bearish scenario is 18.24 resistance.
Bullish Scenario
As mentioned earlier in this USD/MXN analysis, the bulls’ key barrier is 18.24. For the uptrend to resume, the price must exceed the 18.24 ceiling. If this scenario unfolds, the road to 18.73 resistance will likely be paved.
The simple moving average of 50 in the 4-hour chart supports the bullish strategy.
USD/MXN Key Support and Resistance Level
Traders and investors should closely monitor the key levels below to make informed decisions and adjust their strategies accordingly as market conditions shift.
- Support: 18.19 / 18.0 / 17.72
- Resistance: 18.45 / 18.73
Disclaimer: This technical analysis is for informational purposes only. Past performance is not necessarily indicative of future results. Foreign exchange trading carries significant risks and may not be suitable for all investors. Always conduct your research before making any investment decisions.