FxNews—The American currency has been in a bearish trend against the Norwegian Krone since May 11. The decline that began at $11.13 eased near the 61.8% Fibonacci retracement level at $10.62. As of writing, the USD/NOK currency pair trades at about $10.69, approaching 50%50 Fibonacci at $10.72.
USD/NOK Technical Analysis Daily Chart

The daily chart above shows the currency pair has been trading sideways between 61.8% ($10.62) and 50% Fibonacci ($10.72) since May 15.
The technical indicators in the daily chart give a bearish signal, but the stochastic oscillator gives an interesting signal. The %K line has been stuck in oversold territory for six consecutive trading days. Despite the indicators’ oversold signal, the bulls did not demonstrate any significant effort in pushing the price up.
These developments in price action and technical indicators suggest the primary trend is bearish and prevails over the bull market.
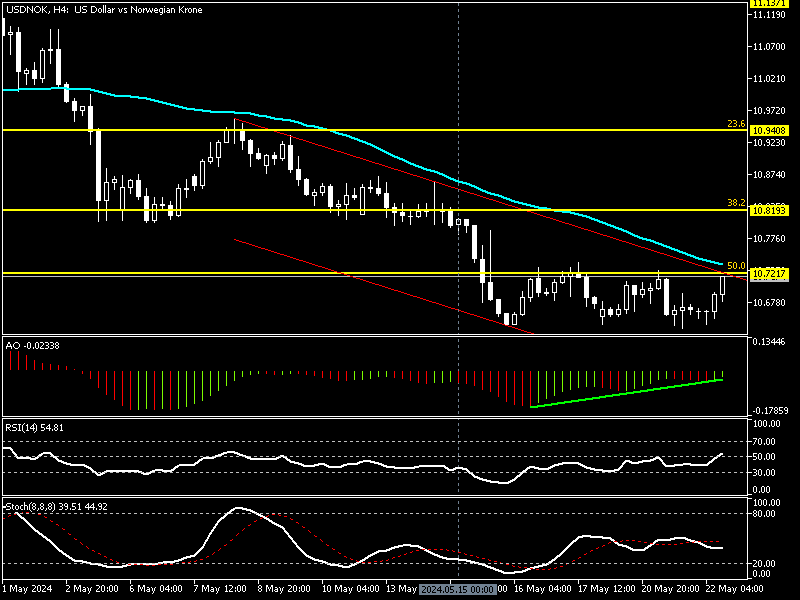
USD/NOK Technical Analysis 4-Hour chart

The awesome oscillator signal divergence in its histogram, recoding -0.02 with green bars. A divergence signal commonly leads the market into a consolidation phase or increases the possibility of a trend reversal. However, in this specific case, the USD/NOK began ranging in a narrow trading area between $10.6 immediate support and $10.72 immediate resistance.
Concurrently, the relative strength index (RSI 14) and Stochastic oscillator (8.8.8) float in the middle, recording 50 and 36, respectively. This outcome interprets the market as neutral, with no significant momentum in the USD/NOK pair.
These developments in the technical indicators and the lack of momentum suggest the trend is neutral, and investors await the price to escape from one of the immediate barriers.
USDNOK Forecast – Bearish Outlook and $10.72 Resistance

From a technical standpoint, the primary trend is bearish. Suppose the price dips below the immediate support at $10.62; USD/NOK’s price could decline to 78.6% Fibonacci at $10.48. For this scenario to come into play, the price must remain below EMA 50 or the descending trendline at about $10.72.
The Bullish Scenario

On the flip side, we have the awesomoe oscillator signaling divergence, which could result in the USD/NOK’s price showing bullish momentum. If the U.S. Dollar closes and stabilizes itself above the immediate support at $10.72 against the Norwegian Krone, the consolidation phase could test the 38.2% Fibonacci at $10.8.
That said, a clear breakout above $10.81 can result in a trend reversal, and the next bullish target could be 23.6% at $10.94.
USD/NOK Key Support and Resistance Levels
Traders and investors should closely monitor the below USD/NOK key levels to make informed decisions and adjust their strategies accordingly as market conditions shift.
- Support: $10.62, $10.48
- Resistance: $10.72, $10.81, $10.94