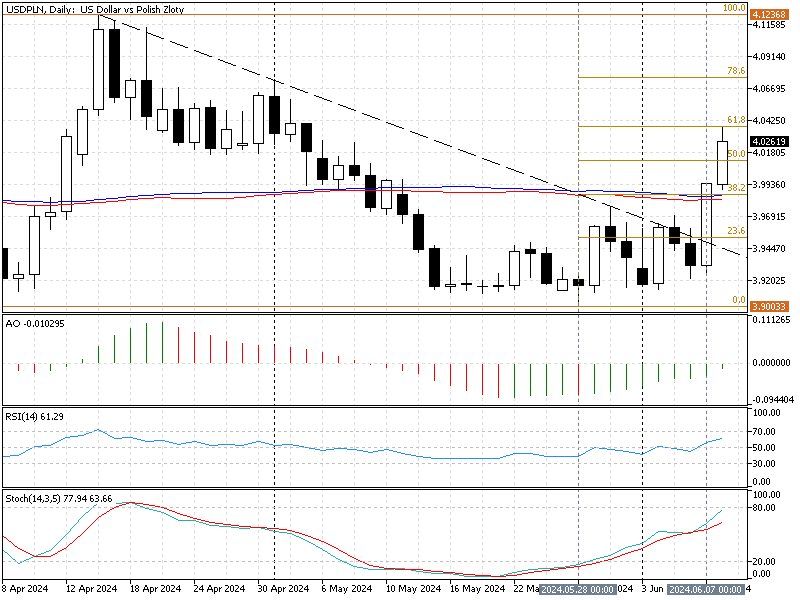
FxNews—The USD/PLN currency pair‘s current bullish wave formed on March 28 from 3.90. The uptrend in discussion escalated after the bulls crossed above the descending trendline, as shown in the daily chart below.
Furthermore, the simple moving average of 50 and 100 could not hold against the strong buying force, and consequently, the price exceeded 38.2% and the %50 Fibonacci levels, the 3.985 and the 4.011 mark, respectively. As of writing, the American dollar trades against the Polish Zloty at approximately 4.026, declining from 4.038, the 61.8% Fibonacci level.

USDPLN Technical Analysis – 10-June-2024
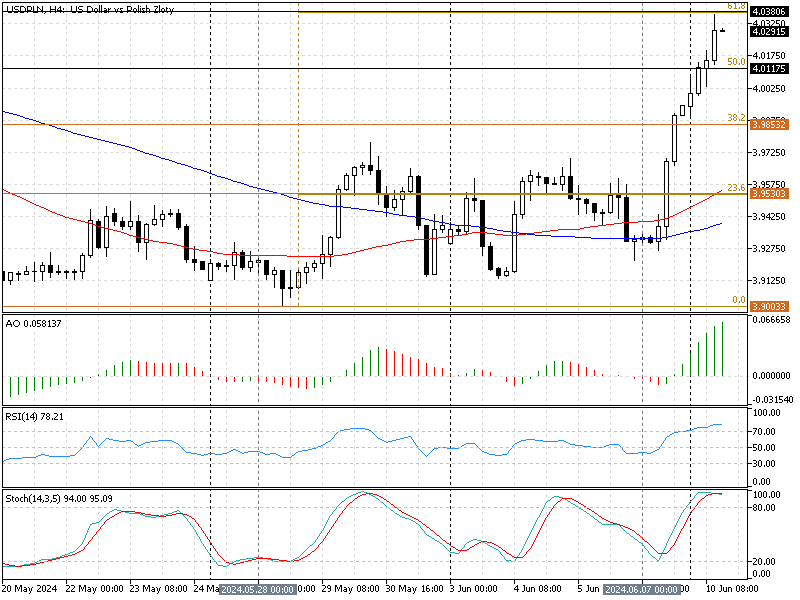
The 4-hour chart below shows that the robust uptrend slowed after the currency pair peaked at the 61.8% Fibonacci level at 4.038. The uptrend pressure has driven the momentum indicators into the overbought territory.

- The relative strength index value is 78, 8 points above the threshold of 70, indicating that the market is saturated with buying pressure and that the price might descend from this point.
- The stochastic oscillator (14, 3, 5) %K line value is 95, 15 points above the threshold of 80, which indicates that the U.S. Dollar is overpriced against the Polish Zloty.
- The awesome oscillator bars are green and tall above the zero line. This growth in the AO oscillator means the bull market prevails.
These developments in the USD/PLN currency pair in the 4-hour chart suggest the primary trend is bullish but overpriced. Therefore, the market might step into a consolidation phase, and the Polish Zloty erasing some of its recent losses could be imminent.
USDPLN Forecast – 10-June-2024

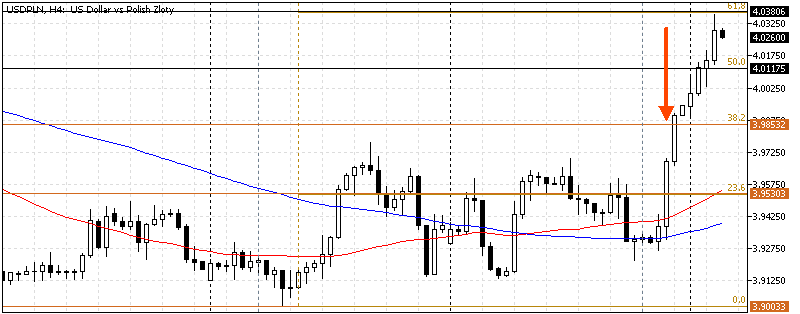
From a technical standpoint, the market is saturated due to the powerful buying stress. Therefore, we expect the price to dip and test the lower support levels, the %50 Fibonacci and the %38.2 Fibonacci levels, 4.011 and 3.98, respectively. These levels can provide a decent entry point to join the bull market, and that is because going long when a trading asset is overbought is not recommended.
The 61.8% Fibonacci level at 4.038 is the primary resistance for the bearish scenario. If this level holds, the consolidation phase in discussion could be imminent.
USD/PLN Bullish Scenario
The 61.8% Fibonacci retracement level is the primary resistance that paused the bullish momentum. If the price exceeds 4.03, the next bullish target could be 4.075. Please note that the SMA 50 and 100 will support the bullish scenario.
USD/PLN Key Support and Resistance Levels
Traders and investors should closely monitor the key levels below to make informed decisions and adjust their strategies accordingly as market conditions shift.
- Support: 4.011 / 3.985 / 3.953
- Resistance: 4.03 / 4.075
Disclaimer: This technical analysis is for informational purposes only. Past performance is not necessarily indicative of future results. Foreign exchange trading carries significant risks and may not be suitable for all investors. Always conduct your research before making any investment decisions.