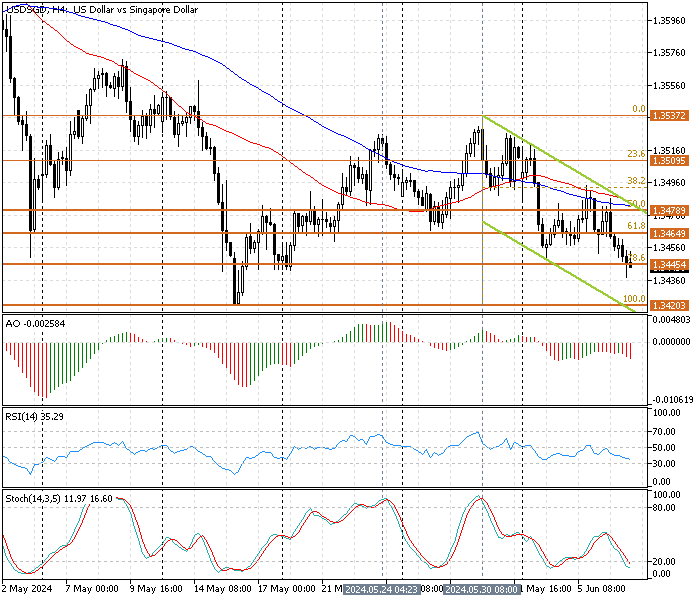
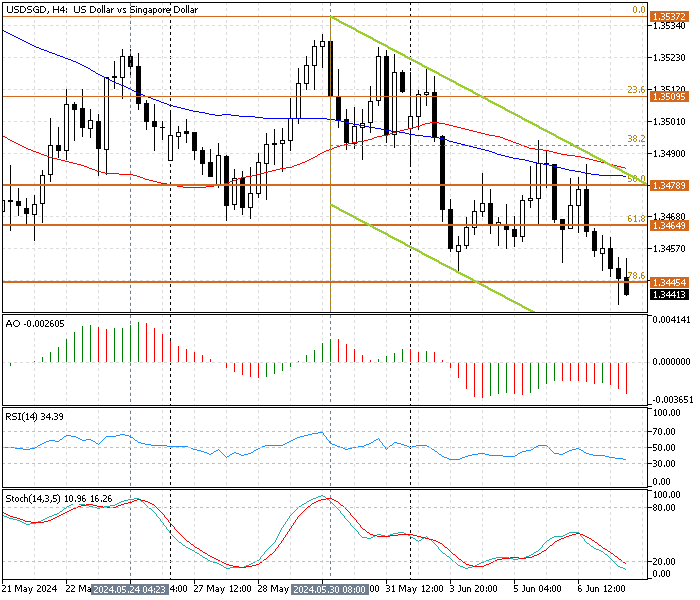
FxNews—In today’s trading session, The U.S. Dollar tested the 78.6% Fibonacci retracement level at about 1.344 against the Singapore dollar. As depicted in the USD/SGD 4-hour chart below, the pair ranges in a bearish flag and moves toward the lower band, which is interpreted as the downtrend prevailing.

USDSGD Technical Analysis – 7-June-2024
The awesome oscillator shows a weak divergence signal while the price is below the SMA 50 and 100, meaning the trend might step into a consolidation phase. The stochastic oscillator backs the awesome oscillator’s divergence signal by floating in the oversold territory, signifying that Singapore’s currency is overpriced and the Dollar might bounce to upper support levels soon.
- On the other hand, the relative strength index value is 36 and declining, demonstrating a robust bearish trend.
These developments in the technical indicators in the USD/SGD 4-hour chart suggest the primary trend is bearish. Still, the U.S. Dollar might erase some of its losses against Singapore’s currency in consolidation. That said, traders and investors should approach the market cautiously.
USDSGD Forecast – 7-June-2024

The stochastic oscillator is in the oversold territory, with the %K period recording 16 in the description. Hence, even though the bear market prevails, joining the downtrend in an oversold condition is not recommended.
That said, we suggest waiting patiently for the USD/SGD price to complete its consolidation cycle near the 61.8% Fibonacci level at 1.346, followed by the upper line of the bearish flag at 1.347.
If this scenario unfolds, traders and investors should closely monitor the critical resistance levels for bearish candlestick patterns such as a doji, an inverted hammer, a bearish engulfing candlestick, or a long wick candlestick pattern before deciding to join the bear market.
Furthermore, if the price dips again from the key resistance levels at 1.346 and 1.347, the USD/SGD exchange rate will likely dip to the May 16 low at 1.342, a support zone backed by the lower line of the bearish flag.
Bullish Scenario
The simple moving average of 100 is the pivotal point between the bear and bull markets. As of this writing, this key resistance is at the 50% Fibonacci resistance level of 1.347.
If bulls breach this demand zone, the USD/DKK price can target the next resistance at the 23.6% Fibonacci level of 1.350. Should the rate exceed 1.350, the May 30 high at 1.353 will be the next resistance.
USD/DKK Key Support and Resistance Levels
Traders and investors should closely monitor the key levels below to make informed decisions and adjust their strategies accordingly as market conditions shift.
- Support: 1.344 / 1.342
- Resistance: 1.346 / 1.347 / 1.350 / 1.353
Disclaimer: This technical analysis is for informational purposes only. Past performance is not necessarily indicative of future results. Foreign exchange trading carries significant risks and may not be suitable for all investors. Always conduct your research before making any investment decisions.