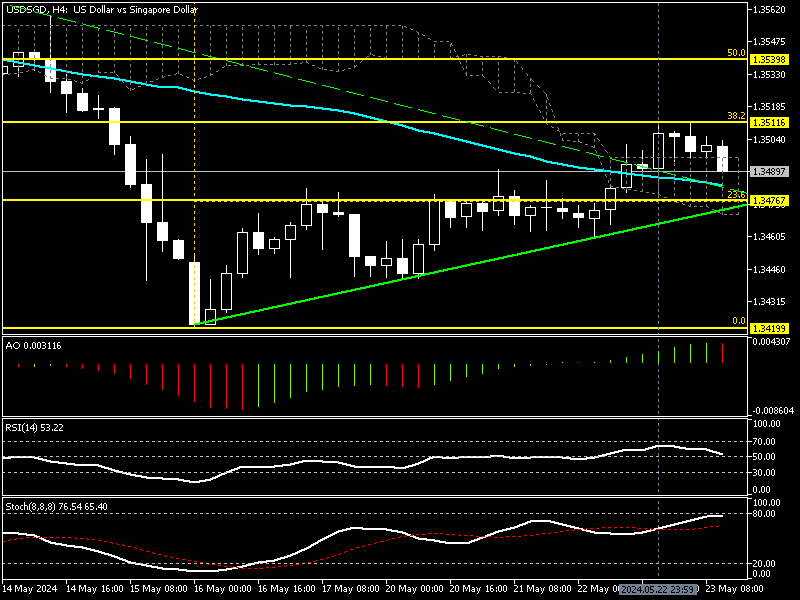
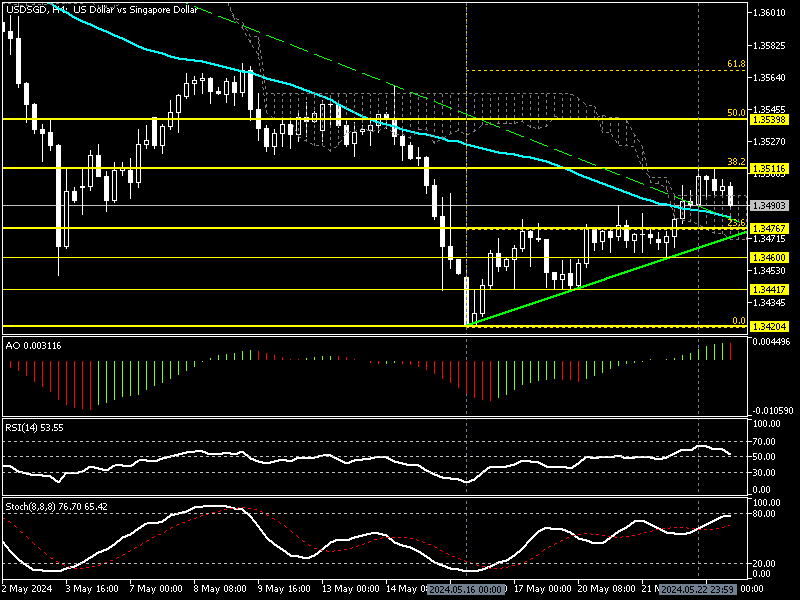
The U.S. Dollar broke out from the descending trendline on May 22 and tested the 38.2% Fibonacci resistance level at $1.351 against the Singapore dollar. The USD/SGD 4-hour chart below demonstrates the breakout and the key Fibonacci levels.

Singapore Food Prices Surge 2.8% in April
Bloomberg–In April, food prices in Singapore increased by 2.8% compared to the same month last year. Bread and cereals, meat, mild, and non-alcoholic beverages increased by 3.5%, 0.1%, 2.7%, and 5.1%, respectively. But, the price of a few food items decreased, such as seafood, which decreased by 5.6%, and fruits, which decreased by 0.5%.
In addition to the main items, the price of fast food has also been affected by inflation, which increased to 6%. This is bad news for Singapore’s economy, meaning the currency’s value might drop against other major players.
USD/SGD Technical Analysis 4-Hour Chart
FxNews—As of writing, the pair dipped from immediate resistance at $1.351. The fall in the price was expected because the currency pair formed a hammer candlestick pattern at the new higher low. If such a candlestick emerges on highs and lows, it can be interpreted as the trend could reverse or consolidate. In this case, as long as the price is above EMA 50, the decline from the key resistance can be considered consolidation.

With the decrease in the USD/SGD exchange rate, the awesome oscillator bars turned red, showing a 0.003 value in the description. The relative strength index is also descending, with a current value of about 54. On the other hand, the stochastic oscillator hasn’t shown bearish momentum yet—the %K line clings to the 80 line with a value of 77.
These developments in the technical indicators suggest the primary trend is bearish and will likely resume. But the bulls closed above EMA 50, Ichimoku Cloud, and maintained a position above the ascending trendline.
USDSGD Forecast – Bears Facing Key Support at $1.347

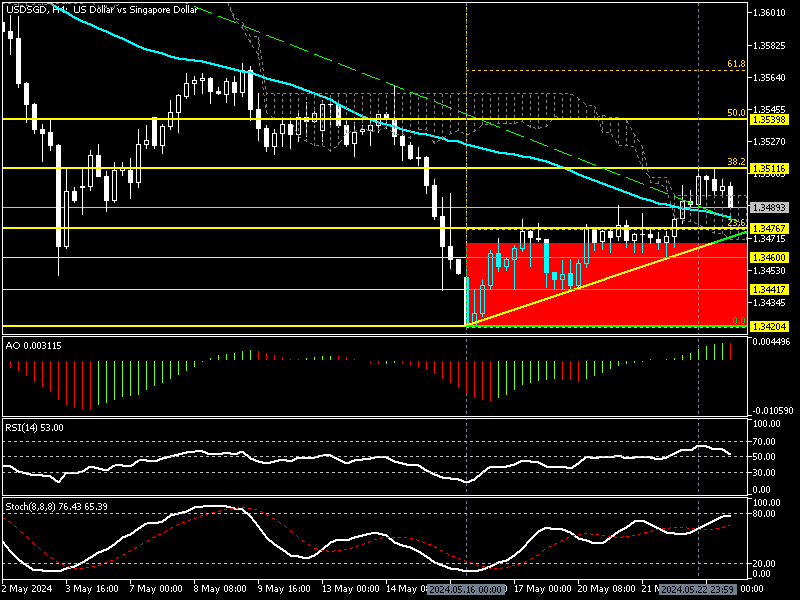
From a technical standpoint, immediate support is at $1.347, backed by the ascending trendline and the 23.6% Fibonacci. For the bear market to prevail, the USD/SGD price should dip and stabilize below the $1.347 mark. If this scenario comes into play, the selling pressure began today and could escalate, targeting $1.346, followed by $1.344 and the May all-time low at $1.342.
The Bullish Scenario

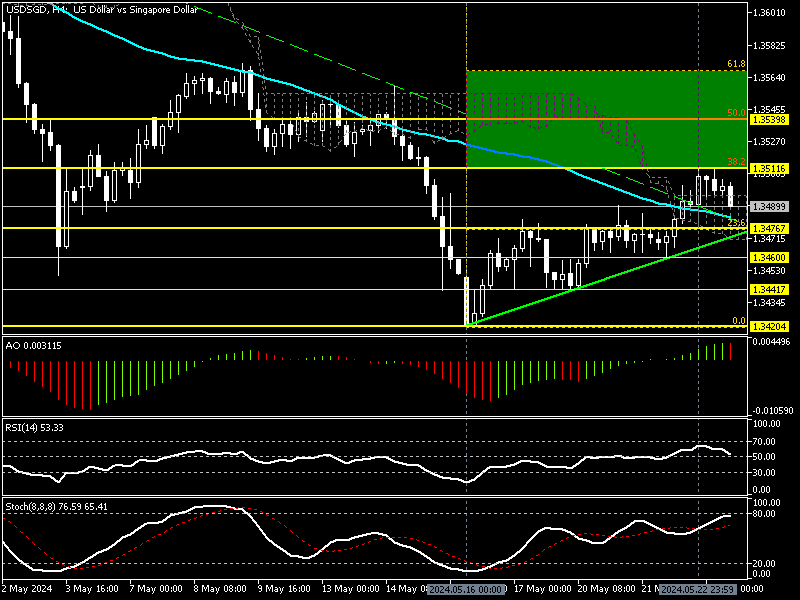
Conversely, if the bulls push the price above the key resistance at $1.351, the bullish wave begun on May 16 can expand and primarily target the 50% Fibonacci at $1.353.
Please note that this scenario remains valid if the USD/SGD price hovers above the ascending trendline, depicted in bold green in the chart.
USD/SGD Key Support and Resistance Level
Traders and investors should closely monitor the USD/SGD key levels below to make informed decisions and adjust their strategies accordingly as market conditions shift.
- Support: $1.347, $1.346, $1.344, $.342
- Resistance: $1.351, $1.353